Published Oct. 15, 2023
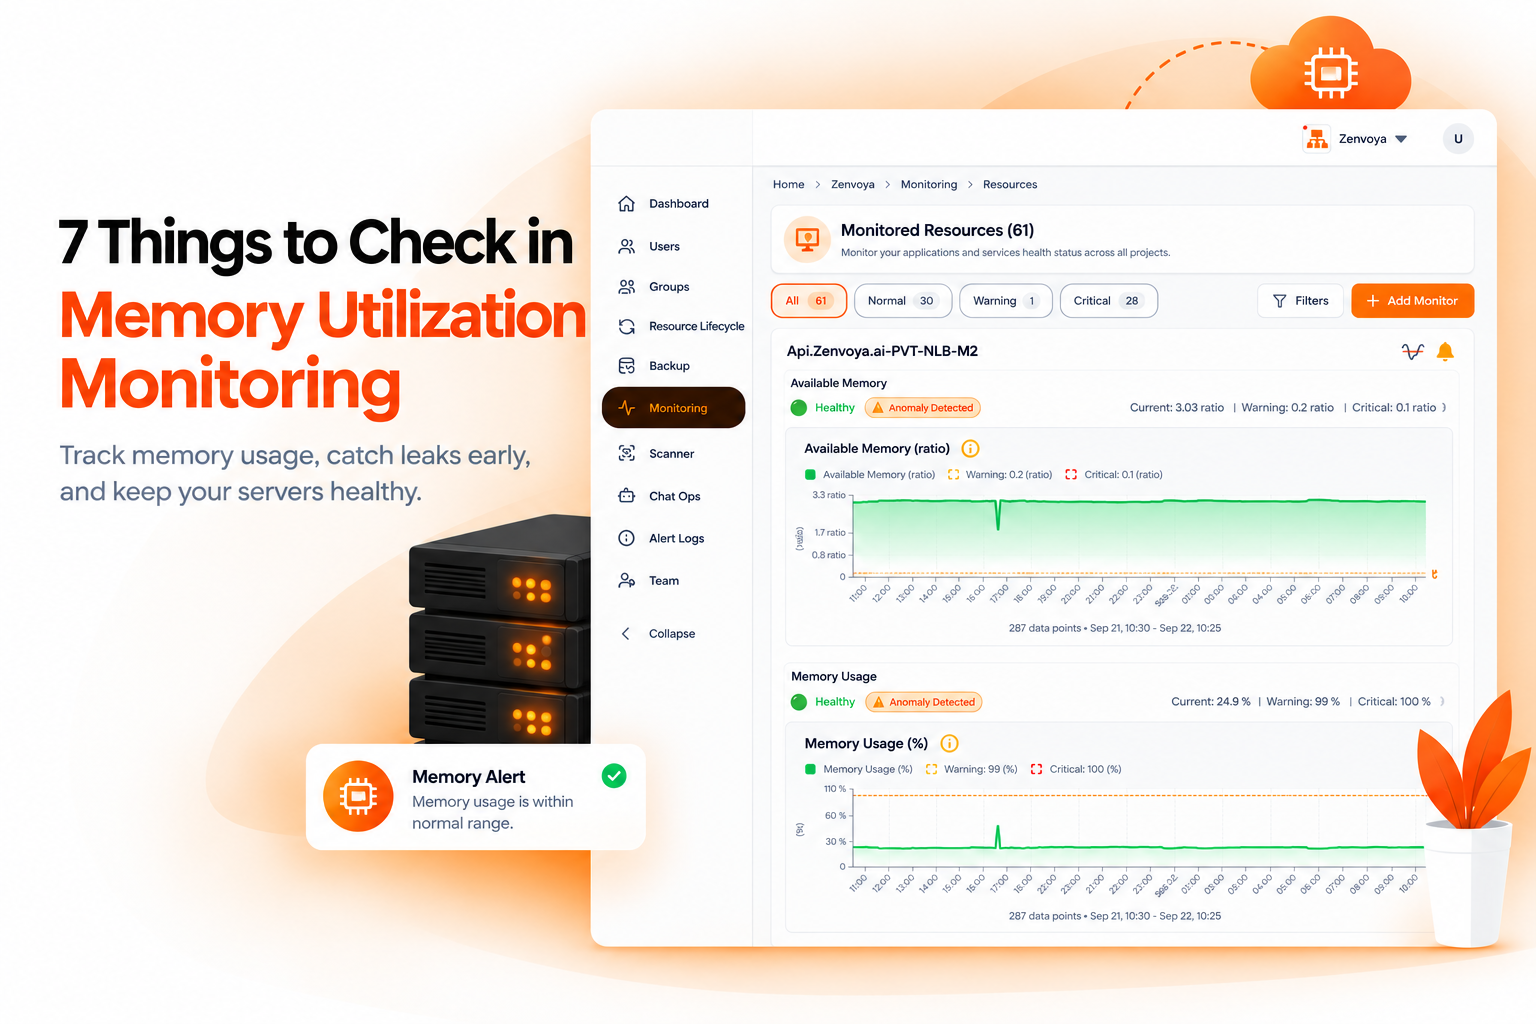
Memory problems have a way of hiding in plain sight. A server can be minutes away from an out-of-memory kill and still look perfectly fine on a dashboard that's only tracking the wrong number, or worse, a dashboard that isn't tracking memory at all.
That last part surprises a lot of people the first time they run into it: on AWS, memory utilization isn't something CloudWatch can see by default. There's no native metric for it sitting in the console waiting to be graphed. If you want memory visibility on an EC2 instance, you need something installed on the machine itself, an agent or plugin that reads memory usage locally and pushes it out as a metric, because the cloud platform itself has no way to see inside the instance's memory the way it can see instance-level things like network throughput.
That single gap is reason enough to double check a memory monitoring setup rather than assume it's covered. Here are seven things worth verifying.
This is the foundation, and it's the one most commonly missed. If you're on AWS and you haven't installed something like the CloudWatch agent, or an equivalent on GCP or Azure, there's a good chance you have no memory data at all, even though the console makes it feel like everything about the instance is being watched.
Before checking anything else on this list, confirm memory is actually being reported in the first place.
A server can show a memory percentage that looks tolerable while swap usage tells a very different story underneath. Heavy swapping means the system has already run out of comfortable memory headroom and started relying on disk, which is dramatically slower, and performance often degrades before the raw memory percentage crosses whatever threshold you've set.
Watching memory percentage without watching swap is an easy way to miss the actual symptom.
A single high memory reading isn't necessarily a problem, but a slow, steady climb that never drops back down between normal usage cycles usually is.
Memory leaks tend to be gradual, which makes them easy to miss on a dashboard tuned only to alert past a fixed threshold. Looking at the trend over days or weeks, not just the current value, is what actually catches a leak before it turns into an outage.
An OOM kill is one of the more disruptive things that can happen to a running process, and it can happen quietly. A process gets killed, something restarts it, and unless you're specifically watching for OOM events in system logs, the whole thing can pass without anyone noticing until a user reports something broke.
A memory monitoring setup that doesn't surface OOM kills is missing one of the clearest signals memory pressure was actually a real problem, not just a number trending upward.
Knowing that a server's overall memory usage is high tells you there's a problem. It doesn't tell you which process is causing it.
Without per-process visibility, tracking down a memory issue often turns into manual investigation after the fact, logging into the box and running commands to figure out what's actually consuming memory. Monitoring that already breaks memory down by process saves that step entirely.
This one causes a lot of false alarms. Operating systems use available memory for disk caching and buffers by design, and that's a good thing, it makes the system faster.
But it also means a raw "memory used" number can look alarmingly high while most of it is just healthy caching that gets released the moment something else needs it.
A monitoring setup that doesn't distinguish actual application memory usage from cache and buffers ends up crying wolf, which trains people to ignore memory alerts altogether.
A database server holding large amounts of data in memory by design has a completely different normal baseline than a lightweight application server.
A single memory threshold applied uniformly across every server either fires constantly on the ones that are supposed to run memory-heavy, or misses real problems on the ones that normally run lean. Thresholds need to reflect what's actually normal for that specific server's role.
The common thread across all seven of these is that memory monitoring needs more than a single percentage and a single threshold to be genuinely useful.
A setup that only tracks raw memory usage against one fixed number will miss swap pressure, leak patterns, OOM events, and the buffer-versus-actual-usage distinction, all of which matter more than the headline percentage on their own.
When evaluating any memory monitoring approach, the real question isn't whether it shows a number, it's whether that number is collected properly in the first place, and whether it's paired with the context that turns a raw reading into something actionable.
Bigbell handles the collection problem directly. Setting up memory monitoring means connecting your account, whether through cloud credentials for AWS, GCP, or Azure, or through a lightweight script for an on-premises Linux box, and Bigbell's plugin-based collection takes care of getting memory data flowing, the same setup path already used for CPU and other server metrics.
Once that's in place, memory sits alongside swap, per-process detail, and the rest of a server's health picture instead of being an isolated number you have to interpret on its own.
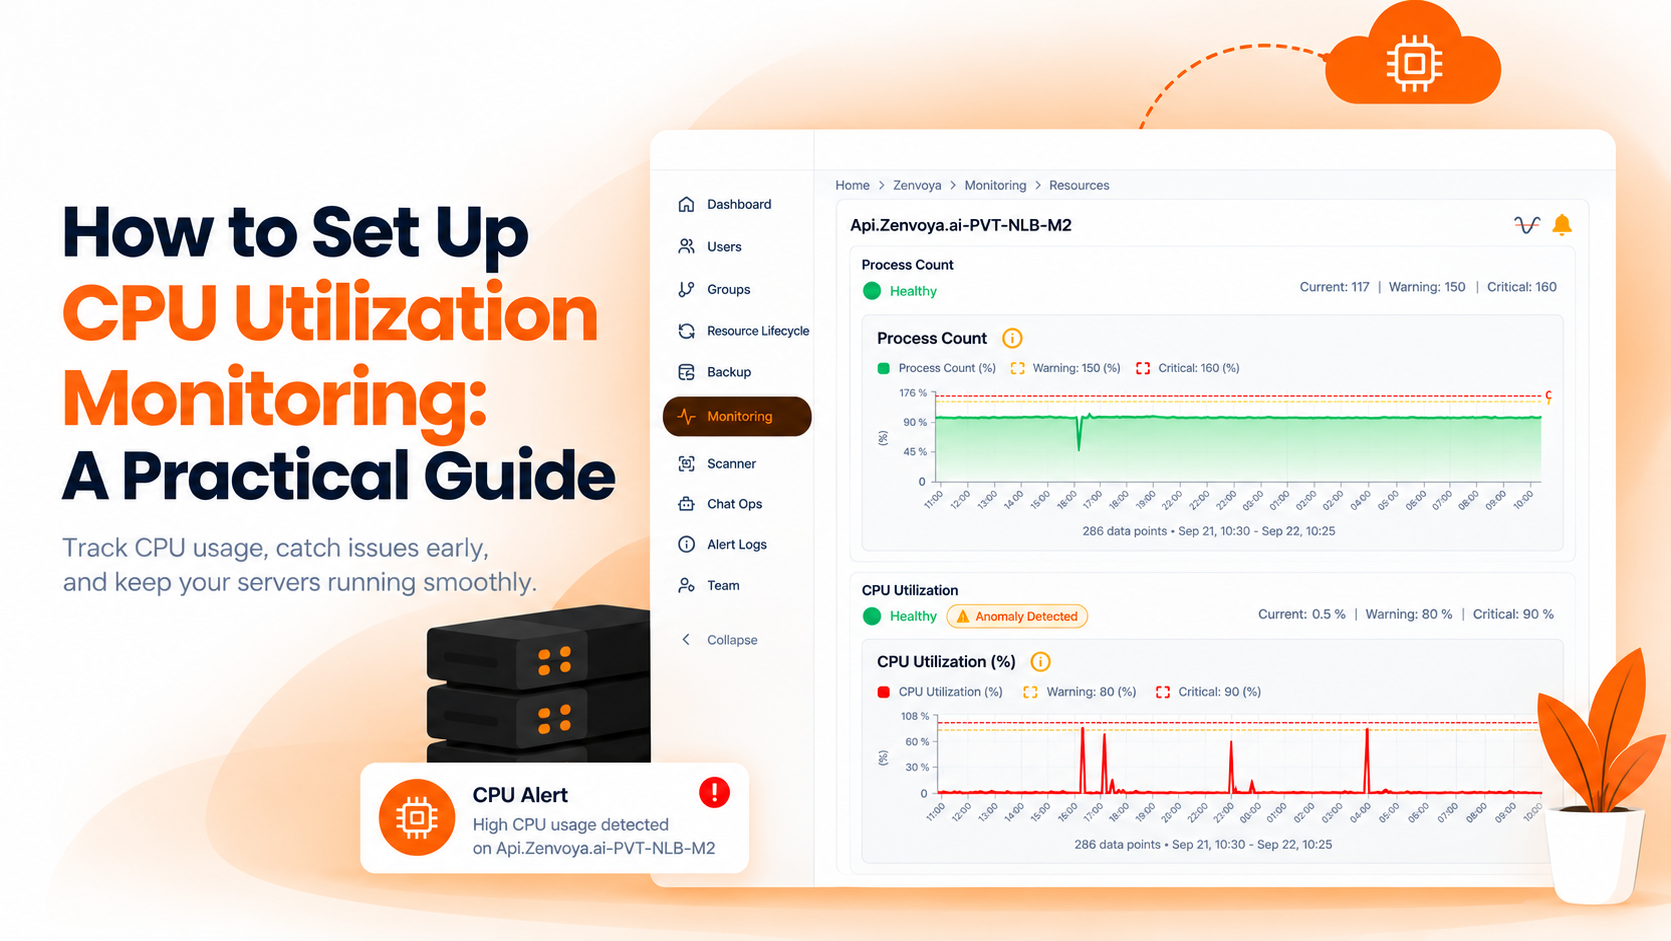
If you're building out monitoring more broadly, this pairs naturally with our guide on CPU utilization monitoring setup, since CPU and memory issues often show up together and are worth watching side by side.
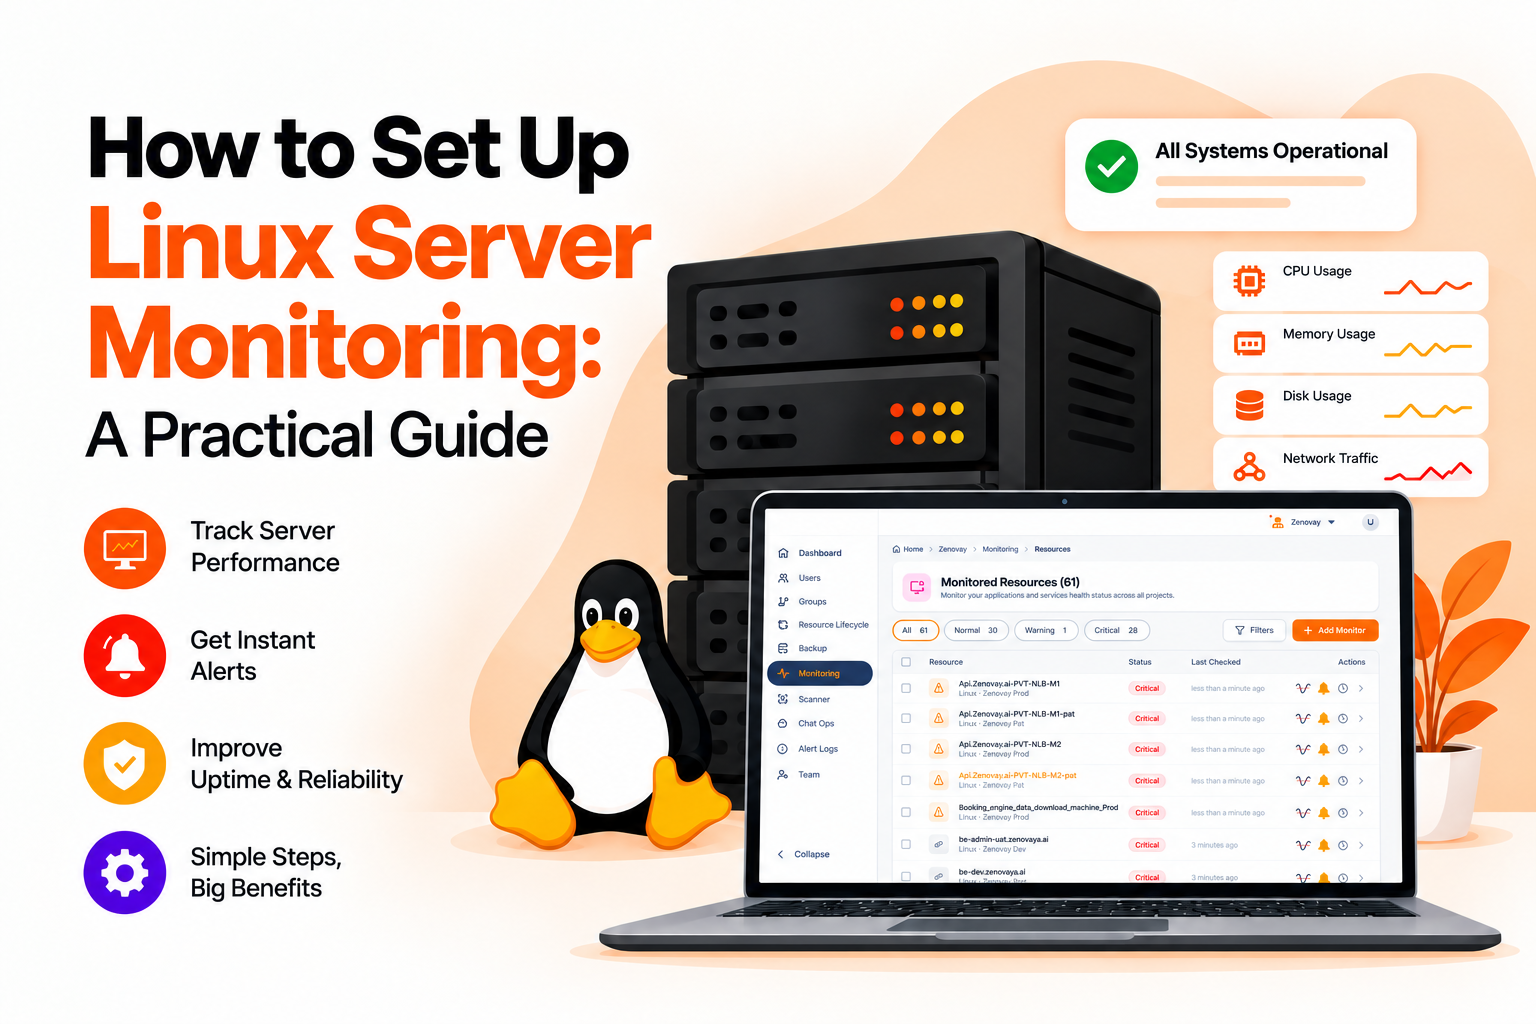
You can see the full setup process in our Linux server monitoring guide, and explore memory monitoring as part of the complete feature set on the Bigbell Monitoring page.