Published Sept. 21, 2026
If you've ever tried to set up monitoring on a Linux server the traditional way, you already know it's not as simple as installing a package and walking away.
A lot of engineers start with sar (System Activity Reporter), which ships with the sysstat package on most distros. It's built into Linux itself, which makes it appealing — no extra server, no agent to install. The catch is that sar only gives you point-in-time or historical CLI output. There's no dashboard, no alerting, and no way to see trends across multiple servers at once. It tells you what happened on a box if you know which command to run and when to run it, which makes it more of a diagnostic tool than a monitoring system.
That's usually why teams move on to something like Nagios. Nagios can genuinely do the job — CPU, memory, disk, process checks, alerting rules, the works — but the setup is a project in itself. You need a dedicated server to run the Nagios core, NRPE or NCPA agents installed and configured on every host you want to monitor, plugins configured per check type, and a fair amount of trial and error getting thresholds and notification rules to behave the way you want. It's powerful, but it's built for someone who's willing to invest real time in the platform, not something you spin up between other tasks.
Netdata takes a different approach — it's agent-based, real-time, and the per-server dashboard is genuinely easy to get running in minutes. The tradeoff shows up when you have more than a handful of servers. Getting a unified view across all of them means running Netdata's centralized streaming setup (a parent node collecting from child nodes), which adds its own configuration overhead, or paying for their cloud offering to get that consolidated view without managing it yourself.
All three are legitimate tools, and all three share the same underlying problem: getting from "I want to monitor my servers" to "I have working, centralized, alerting-enabled monitoring across my fleet" takes real hands-on experience. You're not just installing software — you're configuring collectors, standing up a place to house the monitoring stack itself, wiring up alerting rules, and troubleshooting why a graph isn't populating the way you expected. It's the kind of setup that goes smoothly if you've done it a dozen times before, and eats an entire afternoon (or more) if you haven't.
That complexity is usually the real barrier, not the concept of monitoring itself. Every team knows they should be watching CPU, memory, disk, and process counts on their servers. The part that gets skipped is the setup — because it's tedious, because it needs a specific skill set, and because most engineers would rather be shipping features than debugging a monitoring agent.
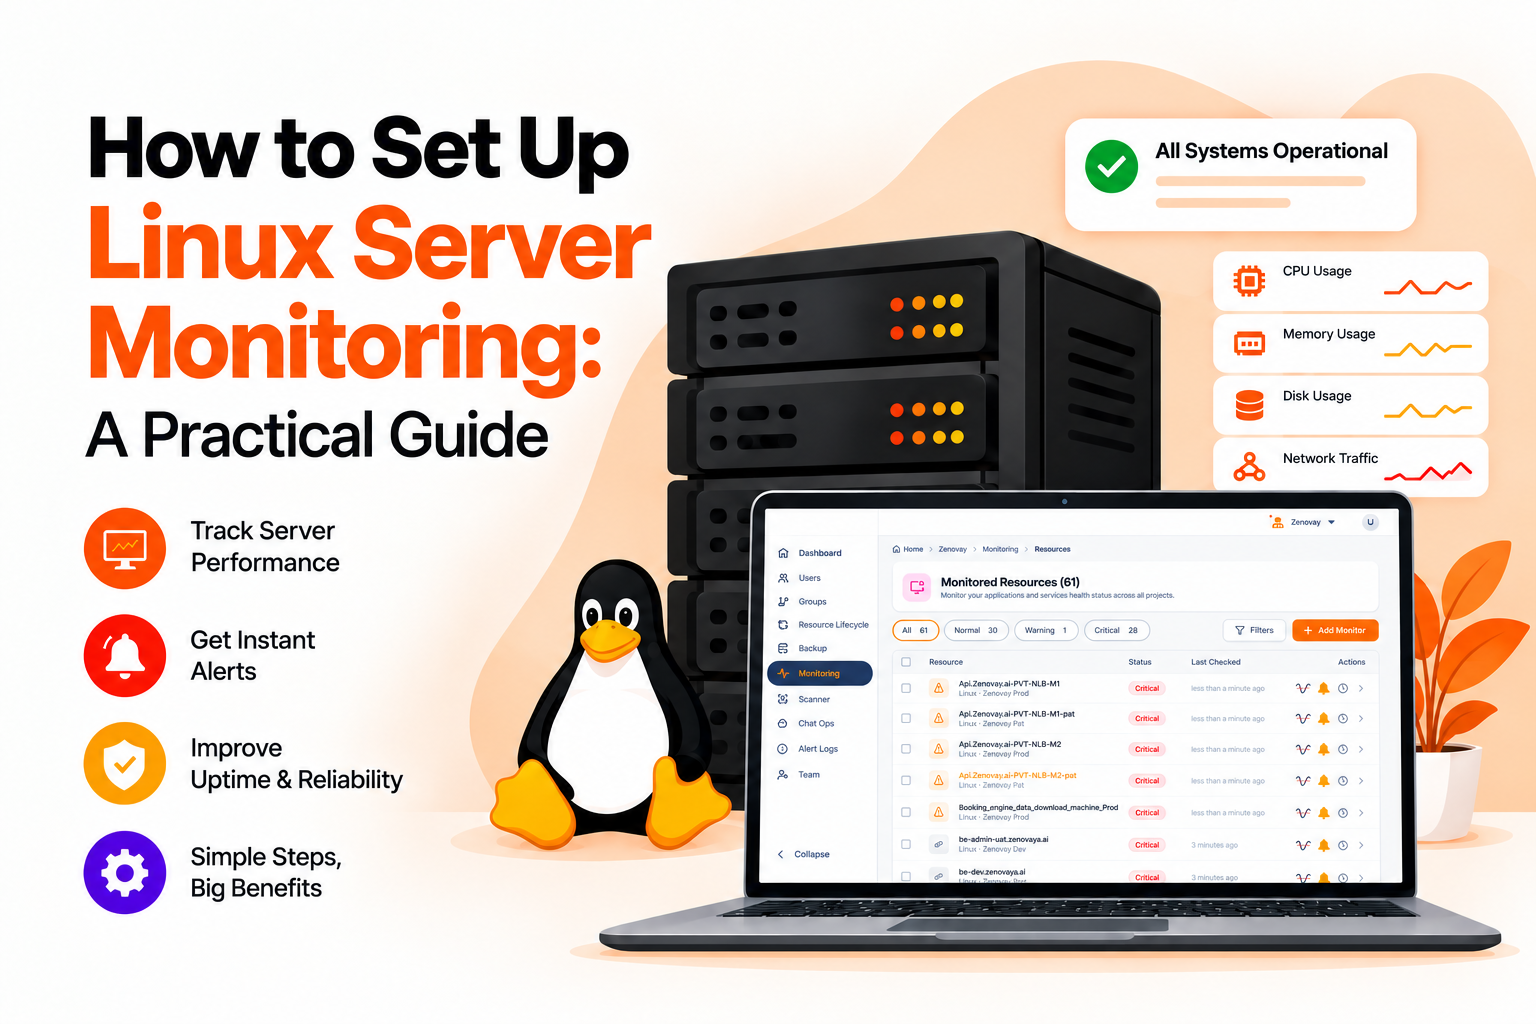
Strip away the tooling debate and the core of Linux server monitoring comes down to a handful of parameters that matter for almost every workload:
The useful part isn't just collecting these numbers — it's deciding on thresholds for each one and having something fire the moment a server crosses them. If memory crosses 85%, someone should know before it hits 100%. If disk usage crosses a set limit, that alert needs to land before the application starts failing writes. Monitoring without threshold-based alerting is just a dashboard nobody's watching.
This is the part where Bigbell's approach differs from the traditional route. Instead of manually installing and configuring a monitoring stack per server, there are two ways to get a server onto Bigbell monitoring, and neither requires deep monitoring expertise.
The steps that come first are the same regardless of which path you take:
From there, you have two ways to actually bring the server under monitoring:
You provide your cloud credentials — AWS, Azure, GCP, or DigitalOcean — and Bigbell discovers the servers running in that environment on its own. From there, you provide server-level credentials, and the monitoring agent installs itself. No manual scripts, no logging into each box individually.
For teams that would rather not hand over cloud credentials at all, Bigbell generates a single zip file tied to that server. You download it, copy it onto the server, unzip it, and execute it. That's the entire setup — the script handles the rest.
Either path lands in the same place: monitoring goes live — CPU, memory, disk, and process counts, with thresholds you define, feeding into a central dashboard instead of sitting scattered across individual servers or buried in sar's command-line output.
Once monitoring is running, the value isn't just in having graphs to look at. It's in what happens when something crosses a threshold. A well-configured setup means someone finds out about a disk filling up before it becomes an outage, not after.
And if you're running Bigbell's ChatOps module alongside monitoring, that "someone finds out" step gets faster too — instead of escalating up to a senior engineer to ask what's wrong, anyone on the team can ask directly through chat and get an answer pulled straight from the monitoring data.
If you're setting up Linux server monitoring for the first time, or migrating away from a tool that's become more maintenance burden than monitoring value, the fastest path is worth trying before committing to another manual stack.
You can see how the full setup works, including project grouping and automated reporting, on the Bigbell Monitoring page.