Published Sept. 15, 2023
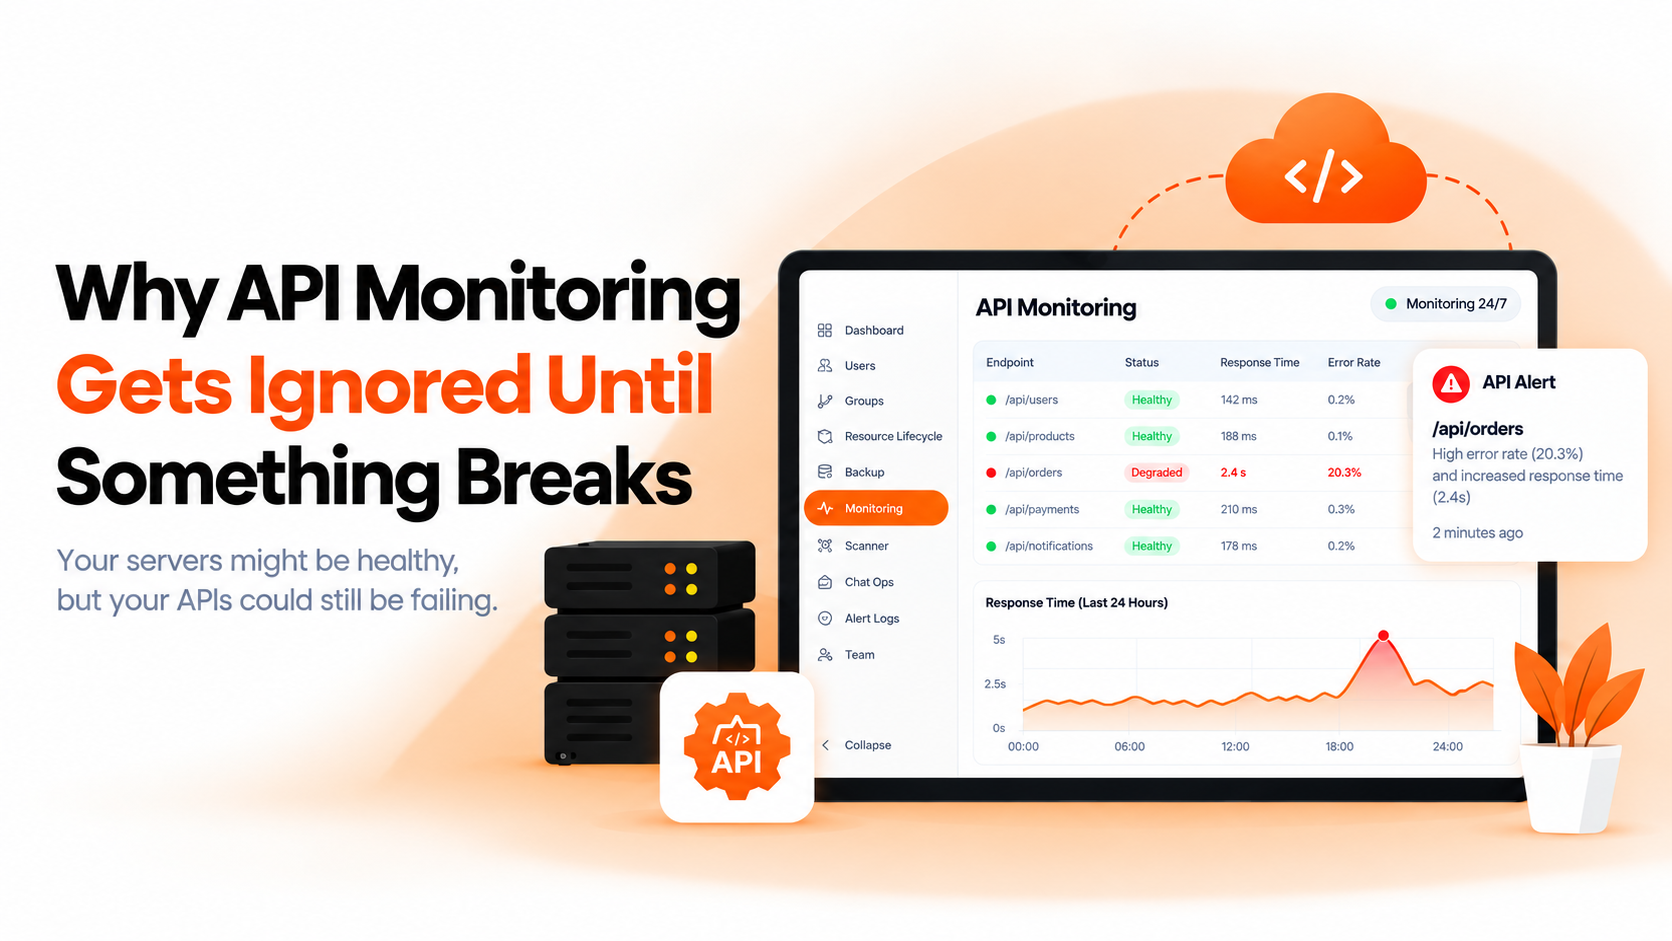
Picture a product with a million users hitting it in a given window. Now picture one of the APIs behind a core feature starts failing for twenty percent of requests. Not all of them, just one in five. Do the math on that and it's two hundred thousand people running into a broken experience, right now, while the dashboard everyone's watching still looks green.
That's the part that catches teams off guard. A server going down is impossible to miss, everyone gets paged, the outage is obvious to anyone looking at CPU or uptime graphs. A partial API failure is nothing like that. The server is fine. The process is running. CPU and memory look completely normal. And yet a meaningful slice of your users are hitting errors, seeing broken features, or waiting on requests that never come back, and none of it shows up unless you're specifically watching the API itself, not just the machine it runs on.
Server monitoring gets built first because it's the obvious thing to build. CPU, memory, disk, whether the process is alive, these are the checks every team sets up early, because they map directly to "is the machine broken." API monitoring is a different, more specific problem, and it tends to get deprioritized because it doesn't fail the same obvious way a server does.
An API can be technically up and still be broken in ways a server-level check will never catch. It might be returning the wrong HTTP status code for a subset of requests. It might be responding correctly but far too slowly for some percentage of calls, degrading the user experience without ever technically erroring out. It might be failing only for a specific endpoint, or only under a certain load pattern, while every other endpoint on the same server responds fine. None of that shows up in a check that just asks "is the server alive." You have to be watching the API's actual behavior, response codes and response times per endpoint, to see any of it.
There's also a psychological piece to why this gets skipped. A server outage is dramatic and undeniable, so it gets fixed and monitored so it never happens again. A twenty percent API failure rate is quiet, it looks like noise. A handful of support tickets trickle in, someone says "the app was acting weird for me earlier," and it gets logged as a one-off rather than a systemic issue affecting a fifth of your traffic. By the time enough tickets pile up to reveal the pattern, the problem may have been running for hours or days.
The real cost here isn't just the technical failure, it's the size of the blind spot. Go back to the math: a million users, twenty percent failure rate, that's two hundred thousand people affected by something nobody on the team even knows is happening. Multiply that by however long it takes for the pattern to surface through scattered support tickets instead of an alert, and you're looking at a large chunk of your user base having a broken experience for an extended stretch, entirely invisible to the people who could fix it.
There's a trust cost layered on top. Users who hit a broken API rarely file a detailed bug report explaining what went wrong. Most just have a bad experience and either retry later or quietly give up on that feature. You lose visibility into the problem at the same time you lose some of the user's confidence in the product, and neither shows up in a dashboard unless you're specifically measuring it.
The fix isn't complicated in concept, it just requires treating API behavior as something worth watching in its own right, separate from server health. That means tracking HTTP response codes per endpoint, not just whether the server is reachable, because a spike in four-hundred or five-hundred series errors on one specific endpoint is exactly the kind of signal a general server check will never surface. It means tracking response time per endpoint too, since a slow but technically successful response is a different failure mode from an outright error, and both matter.
It also means setting a threshold for what an acceptable failure rate actually looks like for each endpoint, and getting alerted the moment that threshold is crossed, rather than waiting for the failure rate to climb high enough that customers start complaining loudly. Twenty percent of a million users is a big number, but the same logic applies at any scale. The point where a manual process would notice this, someone connecting a few scattered tickets into a pattern, is always going to be much later than the point where an automated check would notice it.
This is exactly the gap Bigbell's API monitoring is built to close. It checks response codes and response times continuously, not as a one-time setup, and it does this at the level of individual APIs and endpoints rather than just confirming the underlying server is alive. When an API starts slowing down or throwing errors at an unusual rate, the alert doesn't sit in a dashboard waiting for someone to notice it, it comes through automatically, by email, spelling out specifically which API was affected, how it was behaving, whether it was a slowdown or an error spike, and when it started. That's the difference between finding out about a problem from a handful of confused support tickets days later, and finding out the moment it starts happening.
Because this runs alongside Bigbell's broader monitoring and ChatOps, you're not stuck cross-referencing separate tools to figure out whether an API issue is related to something happening on the server itself. You can ask directly, in chat, what's going on with a specific API or server, and get an answer instead of digging through logs across multiple dashboards.
How is API monitoring different from server monitoring? Server monitoring tells you if the machine is healthy, CPU, memory, disk, whether the process is running. API monitoring tells you if the actual requests going through that server are succeeding and responding fast enough. A server can be perfectly healthy while the API running on it fails for a meaningful share of requests.
What's a reasonable failure rate to alert on? There's no single universal number, it depends on the endpoint and how critical it is, but the key point is that any threshold you set and actively monitor is better than discovering failures through user complaints, since complaints only surface a fraction of what's actually happening.
Can API monitoring catch third-party API failures too? Yes, if you're calling out to external services like payment gateways or messaging providers, monitoring the response codes and response times of those calls specifically will catch degradation on the provider's end before it becomes a wider outage for your users.
If you're already using URL monitoring for your website, it's worth pairing it with API monitoring, since the URL monitoring checklist covers the front-end-facing side of this same problem. You can see the full API monitoring capability on the Bigbell Monitoring page.