Published Sept. 21, 2026
Windows servers don't fail quite the same way Linux servers do, and if you've managed both, you already know that getting good at monitoring one doesn't automatically prepare you for the other. Windows has its own personality when things go wrong. Services stop quietly instead of crashing loudly. Event logs flag trouble days before a performance graph shows anything unusual. And if IIS is part of the picture, it brings a whole set of headaches that have nothing to do with CPU or memory at all. After managing a fair number of Windows environments, here's the checklist that actually holds up.
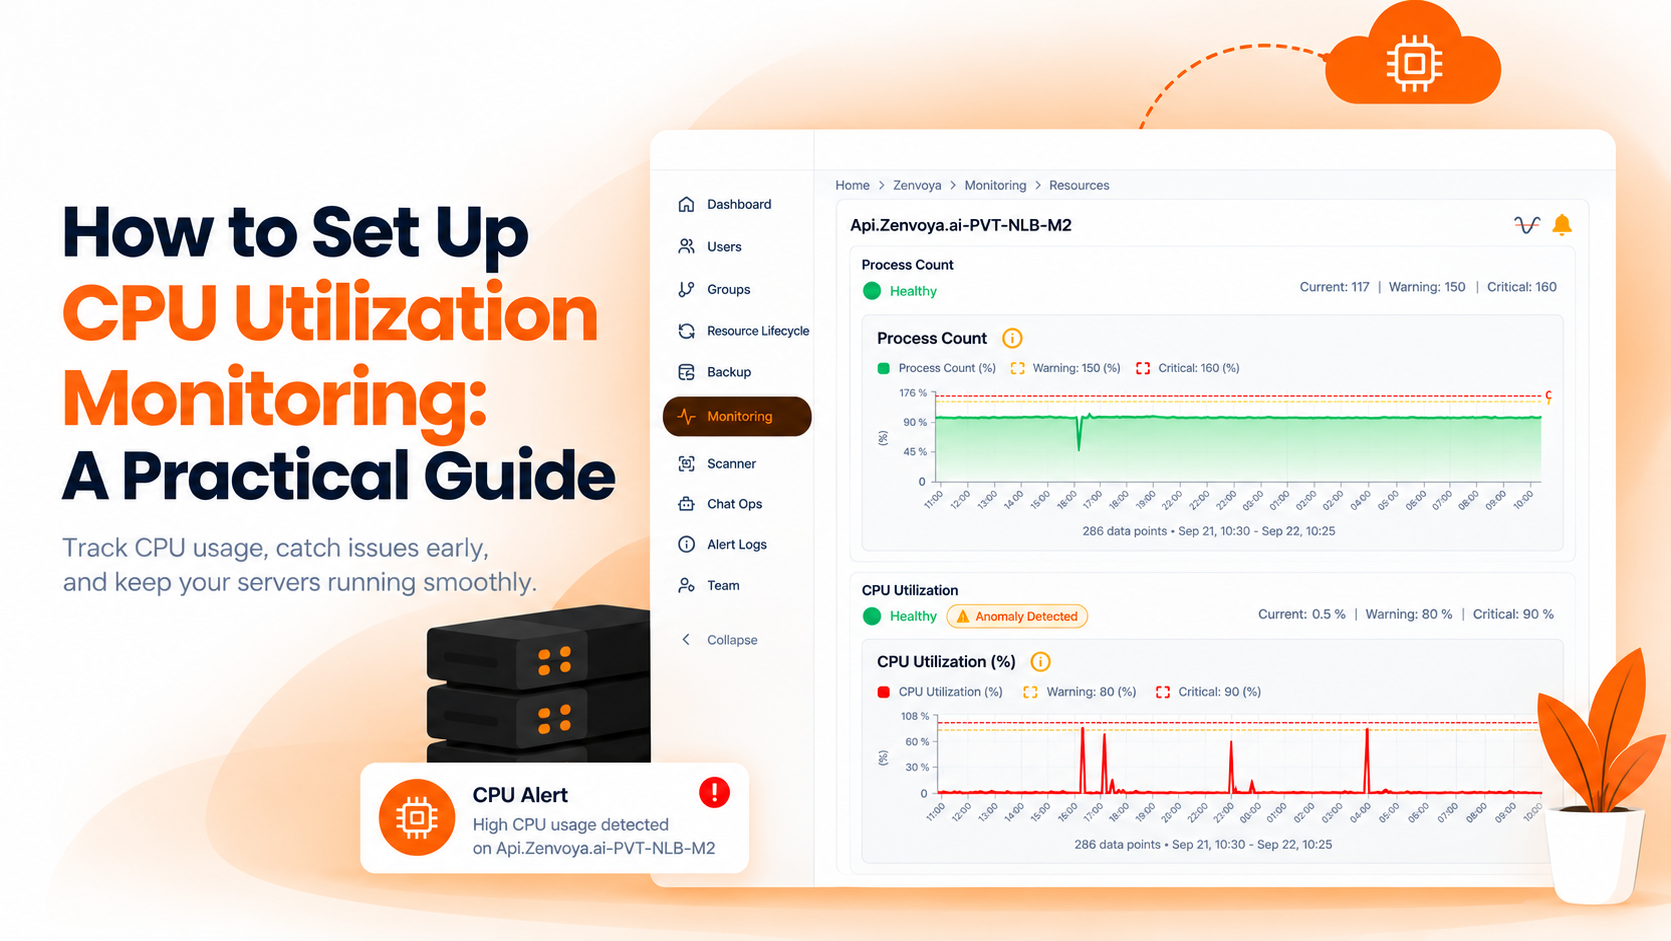
Start with CPU utilization, because it's the one almost everyone already watches, and for good reason. A sustained spike is usually the first thing anyone notices, whether it's a runaway process eating cycles it has no business eating, or the server simply outgrowing the load it was originally sized for. The tricky part with CPU on Windows isn't spotting a spike, it's telling a short burst from a genuine problem. A server pegged at 95% for thirty seconds during a scheduled task is nothing. The same number sustained for twenty minutes during normal business hours is a different story entirely, and your monitoring setup needs to know the difference.
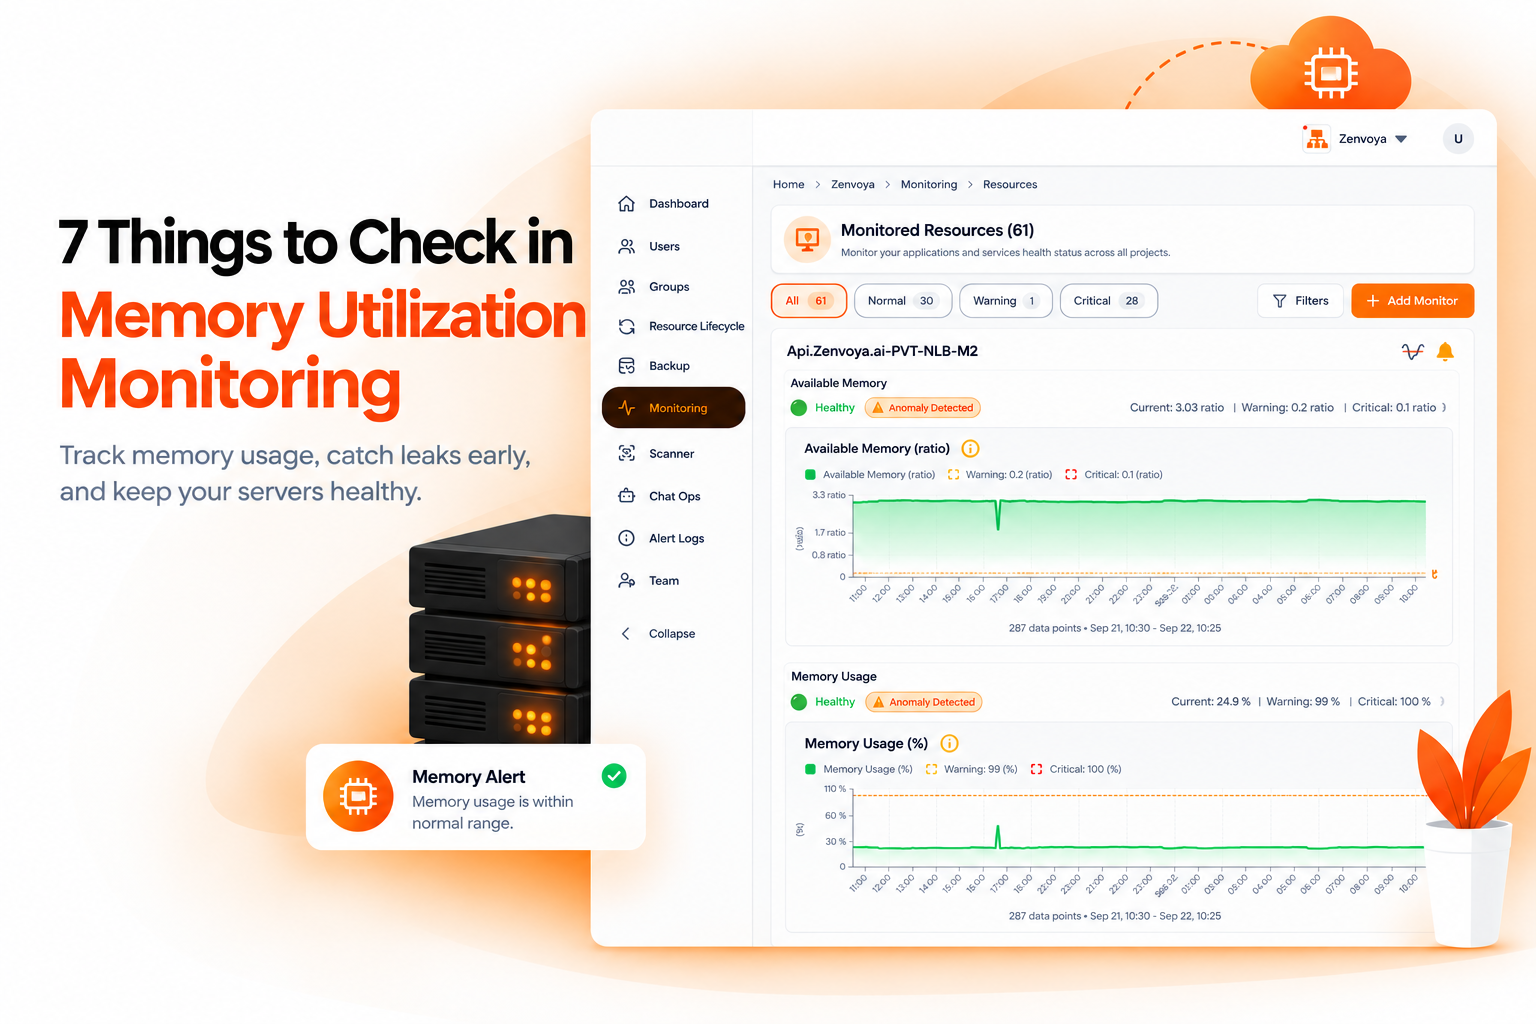
Sitting right next to CPU is memory usage, and this is where Windows servers have a reputation that's mostly earned. Memory leaks on Windows tend to be slow and patient. A process quietly holds onto a little more memory than it should, nothing alarming shows up for days, and then one morning the server is swapping heavily and everything running on it has slowed to a crawl. By the time someone notices, the leak has been building for a while. Catching this early means watching the trend over days, not just the current number.
Disk space rounds out what you'd call the basics, and it remains one of the most avoidable causes of a Windows server going down. It's rarely dramatic. A log file grows unchecked for a month, a temp directory never gets cleaned, and suddenly there's no room left for the OS to do anything, including write the very logs that would explain what happened. Anyone who's had to explain a preventable outage caused by a full volume knows this one deserves a permanent spot on the list.
This is where things start diverging from Linux. Windows server health depends heavily on services status, and services on Windows don't fail the way a Linux daemon crashes with a visible error. A service can simply stop. No crash message, no obvious signal, just a process that's no longer running until something downstream breaks and someone starts asking why. Whether it's a backup agent, a monitoring agent itself, or something core to an application stack, a stopped service sitting unnoticed for hours is a very Windows-specific way for things to quietly go wrong.
Application log monitoring deserves its own line, and honestly it might be the single most underused signal on this whole list. The Windows Event Log, particularly the Application and System logs, tends to surface warnings and errors well before CPU or memory graphs show anything out of the ordinary. A driver throwing intermittent errors, an application logging failed connection attempts, a service restarting itself repeatedly — these show up in the event log long before they show up as a performance problem. If the server is doing any web-facing work, IIS error logs fall into this same category and are worth watching just as closely, since a spike in 500-level errors often means trouble well before the server itself looks stressed.
Network utilization matters more on Windows servers than people tend to expect going in. Servers handling RDP sessions, file shares, or any kind of print services can quietly turn network bandwidth into the actual bottleneck, even while CPU and memory look completely fine. It's an easy one to overlook because it doesn't announce itself the way a maxed-out CPU does. Users just start complaining that things feel slow, and without network monitoring in place, that complaint is hard to chase down to a root cause. This is especially true in smaller IT teams, where a vague "the server feels slow today" complaint from one department can eat half a day of troubleshooting before anyone thinks to pull up a network graph, and even then, it only helps if that graph already existed before the complaint came in.
Last on the list, process count and disk queue length travel together, and both tend to catch trouble before the more obvious metrics do. A sudden jump in process count usually means something is misbehaving, spawning processes it shouldn't, even while CPU and memory still look reasonable. Disk queue length is arguably the more useful early warning of the two, because it catches a storage slowdown building up well before that slowdown ever shows up as a disk-space or performance alert. By the time disk space itself looks like a problem, queue length has usually already been climbing for a while.
Put all seven together and you've got a genuinely solid picture of a Windows server's health, catching issues at the point they're just starting to form rather than after they've already caused an outage. The challenge, as anyone managing more than a handful of these servers already knows, is that watching all seven manually, across every server, every day, isn't realistic. It's the kind of thing that gets done diligently for the first week after a setup and quietly falls off from there, usually right around the time it would have actually mattered.
This is the same gap Bigbell was built to close for Linux, and it works the same way here. Connect your cloud credentials and let Bigbell automatically discover your Windows servers, or install the agent directly if you'd rather not share cloud access. Either way, all seven of these checks run continuously in the background, with alerts firing the moment something crosses a threshold you've defined, rather than waiting for someone to notice a graph trending the wrong way. For teams managing a growing number of Windows servers, that's really the difference between catching a problem while it's still small and finding out about it from an angry ticket days later.
See also: How to Set Up Linux Server Monitoring if you're managing a mixed Linux and Windows fleet. Full details on the monitoring module are on the Bigbell Monitoring page.