Published Oct. 5, 2026
As modern cloud infrastructure scales, maintaining visibility into your environment becomes increasingly complex. The most common pain point engineering teams hit with AWS server monitoring is fragmentation. When you are running hundreds of EC2 instances, highly distributed serverless Lambda functions, and massive RDS databases, trying to keep track of every moving part can quickly become a logistical nightmare. Without a structured, unified approach to monitoring, teams inevitably face silent application failures, undetected performance bottlenecks, and skyrocketing cloud bills.
In a dynamic AWS environment, resources are constantly being provisioned and terminated. If your monitoring strategy relies on manual checks or scattered, disconnected tools, you are always going to be one step behind the next critical outage. To maintain high availability and prevent revenue-impacting downtime, you need a proactive, automated monitoring strategy.
Implementing a robust AWS server monitoring strategy is not just about keeping your applications online; it is about maintaining complete operational control over your cloud architecture.
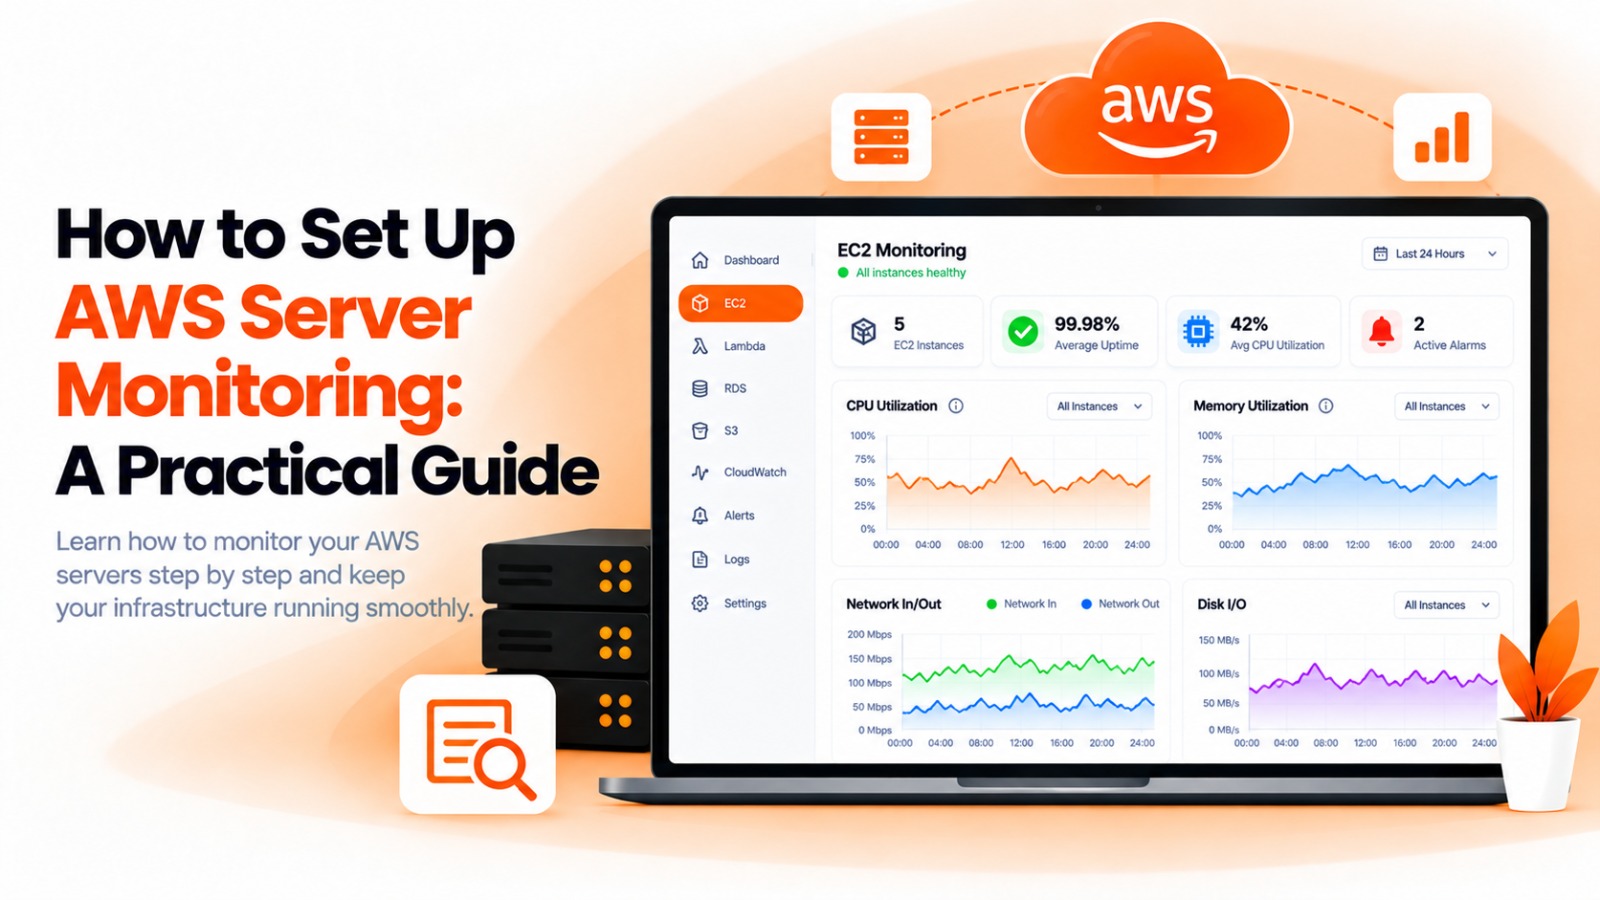
First, comprehensive monitoring is the only way to genuinely prevent downtime. By tracking real-time metrics across your EC2 instances, load balancers, and managed databases, you can detect dangerous trends — like a sudden spike in CPU utilization or a rapidly filling EBS volume — long before they cause a system crash.
Second, it directly impacts your bottom line. Cloud costs can spiral out of control if abandoned resources are left running. By monitoring your AWS bills alongside your active infrastructure, you can identify idle EC2 instances or over-provisioned Auto Scaling groups and optimize your monthly spend.
Finally, effective monitoring improves the end-user experience. By keeping a close eye on latency metrics through Application Load Balancers (ALB), API Gateways, and CloudFront distributions, your team can ensure that backend processing delays do not negatively impact your customers.
Setting up an effective cloud monitoring architecture requires careful planning and execution. Follow these structured steps to ensure your AWS environment is fully covered:
Begin by mapping out exactly what needs to be monitored across your entire architecture. Do not just focus on your primary EC2 web servers. Ensure you explicitly include your backend RDS databases, DynamoDB tables, SQS queues, and S3 storage buckets. Every single service that impacts your application's reliability, user experience, or data integrity must be fully accounted for in your monitoring strategy.
Once your resources are identified, define what healthy performance looks like. Set specific thresholds for critical metrics. For example, configure a warning alert when an EC2 instance hits 75% memory utilization, and a critical emergency alert when it reaches 95%. This tiered approach ensures that minor issues do not trigger massive panic.
An alert is completely useless if the right engineer never sees it. Configure your notification systems to route alerts based on severity. Standard warnings can be sent to a dedicated Slack channel or an email inbox. However, critical database failures should immediately trigger an SMS or an automated voice call to the designated on-call engineer.
Develop a system to track the lifecycle of your alerts. Implement backend rules to detect if a server has been in a continuous down state for extended periods — such as 72 hours. This helps administrators quickly identify and prune dead or deprecated infrastructure, keeping your monitoring dashboard clean and actionable.
Even experienced teams stumble when configuring their cloud visibility. The most frequent mistake is alert fatigue. If you configure your system to send a critical alert for every minor CPU spike or temporary network blip, your engineers will eventually start ignoring all notifications. When a genuine emergency finally strikes, it will go entirely unnoticed amidst the noise of false positives.
Another major pitfall is relying on deeply fragmented tools. Using one platform to monitor your ECS containers, another to track your ElastiCache cluster performance, and a completely separate financial dashboard for your AWS Billing creates dangerous operational blind spots. When an outage occurs, engineers waste valuable time switching between disconnected dashboards trying to piece together the root cause, ultimately extending your downtime.
Manually configuring and maintaining this setup across a growing cloud environment is incredibly tedious. BigBell simplifies AWS server monitoring by providing a native, unified platform that natively integrates with your AWS architecture.
By securely providing your AWS Access Key ID, Secret Access Key, and Region, BigBell automatically connects to and monitors your entire stack. BigBell natively supports monitoring for EC2, RDS, Lambda, DynamoDB, Application Load Balancers (ALB), S3, SQS, CloudFront, ECS, and dozens of other managed services — all from a single, centralized dashboard. It even tracks your AWS Bills directly alongside your performance metrics.
BigBell also features an advanced multi-channel delivery system, allowing you to seamlessly route alerts via Email, SMS, Voice Calls, or Webhooks. Furthermore, its intelligent backend actively tracks long-running incidents, automatically flagging resources that have been continuously down for over 72 hours.
Stop struggling with fragmented tools and missed alerts. Gain complete visibility into your cloud infrastructure today. Book a demo with BigBell and automate your AWS monitoring effortlessly.
It is the automated process of tracking the health, performance, capacity, and security of your Amazon Web Services infrastructure. This includes actively monitoring compute instances, managed databases, load balancers, and storage solutions to ensure high availability and optimal performance.
BigBell offers incredibly comprehensive AWS integration. It natively supports EC2, RDS, Lambda, DynamoDB, ALB, NLB, SQS, SNS, S3, CloudFront, ECS, EKS, Auto Scaling, Route53, WAF, Redshift, ElastiCache, OpenSearch, API Gateway, and even your overall AWS Bills, providing complete full-stack visibility.
BigBell securely connects to your AWS architecture using standard AWS Access Key IDs, Secret Access Keys, and region identifiers. This allows BigBell to securely fetch metrics and monitor your managed resources without requiring complex, manual agent installations on every single server.
Yes, BigBell allows you to configure multi-tier threshold alerts. You can define specific limits for both warnings and critical emergencies. This ensures your team is notified of potential issues early, preventing minor bottlenecks from escalating into major production outages.
Absolutely. BigBell includes a robust multi-channel notification routing system. You can easily configure the platform to send standard emails for routine warnings, while triggering immediate SMS messages and automated voice calls for critical, late-night emergencies.
Yes. BigBell continuously monitors the state of your alerts and tracks the exact time an incident begins. Its backend operations can automatically identify and flag alerts that have been in a continuous down state for 72 hours, helping you maintain a clean environment.
Monitoring your AWS Bills directly alongside your performance metrics allows you to instantly correlate spikes in infrastructure usage with rising costs. By keeping a close eye on your financial metrics, your team can proactively identify expensive, over-provisioned resources and optimize your cloud spend before you receive an unexpectedly high invoice at the end of the month.