Published Oct. 5, 2023
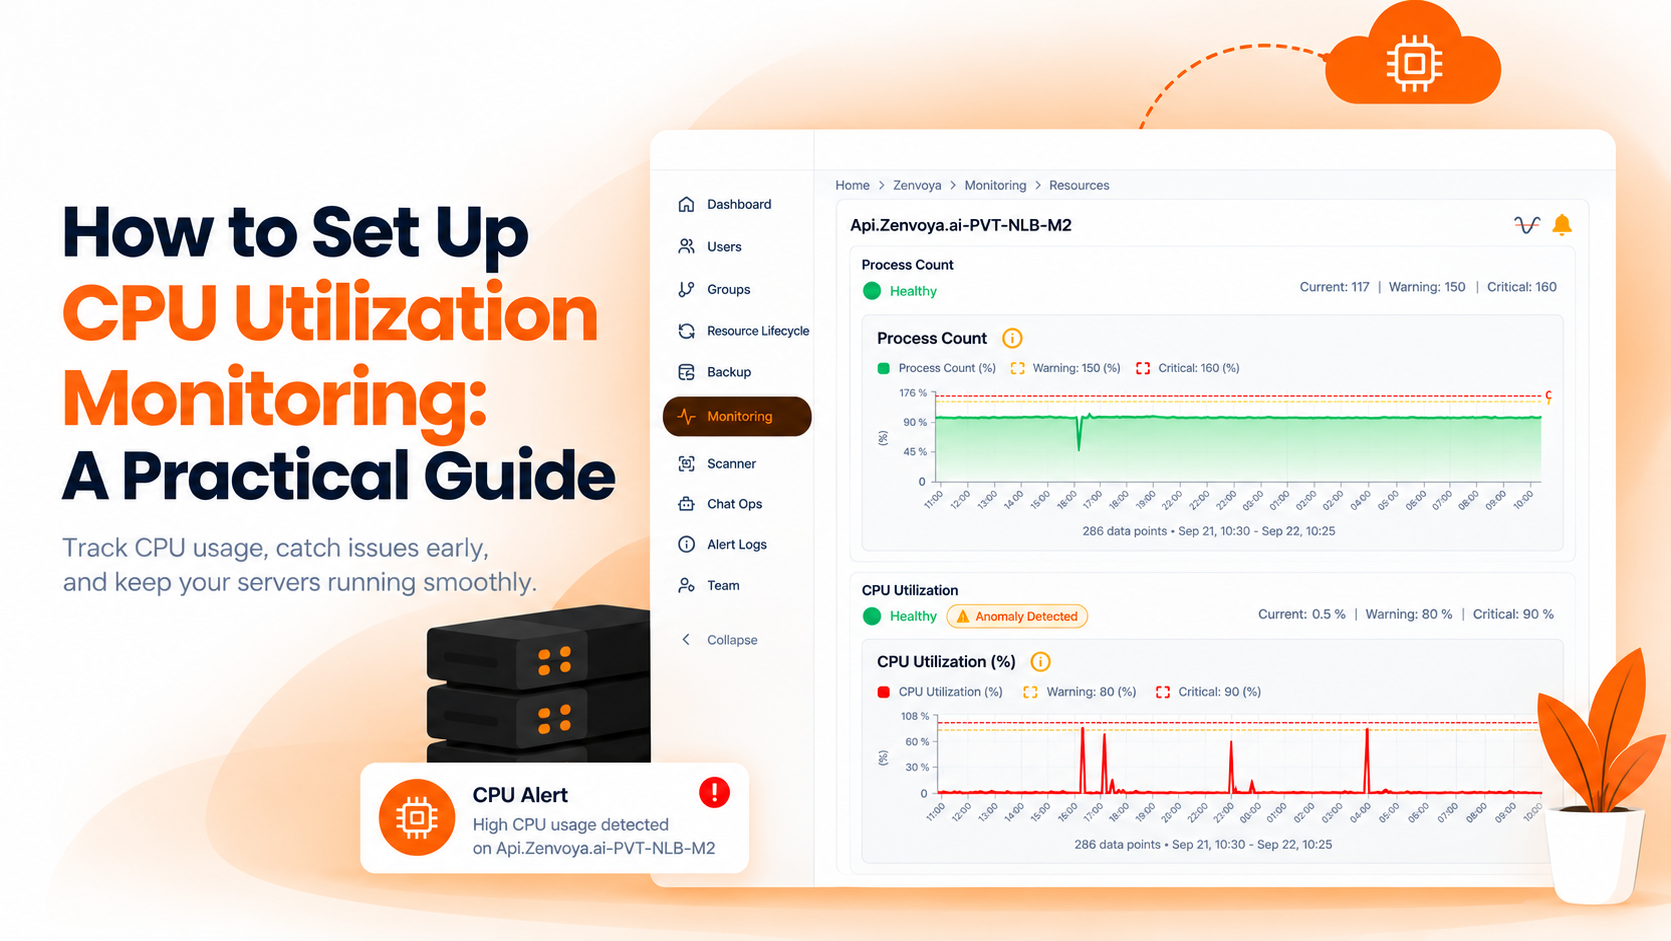
CPU monitoring sounds like the simplest thing in the world. Check how busy the processor is, alert someone if it gets too high, done. In practice, most teams either skip it entirely because setting up a traditional monitoring tool feels like a project of its own, or they set it up narrowly, watching raw utilization percentage and missing the things that actually predict trouble before it hits.
A CPU running hot isn't just a number on a graph, it's usually the earliest visible sign that something downstream is about to get worse. Applications slow down, requests queue up, and if nothing catches it early, users start noticing before anyone on the team does. The tricky part is that CPU utilization alone doesn't tell the whole story. A server can show completely reasonable CPU usage while still struggling, because the real bottleneck is something adjacent to raw usage, not the usage number itself.
This is especially true in cloud environments. On platforms like AWS, burstable instance types don't just have a CPU percentage to watch, they have CPU credits, a mechanism that governs how much burst capacity is available before performance gets throttled. A server can look like it has plenty of headroom on a basic utilization chart while quietly running out of credits, and once those credits are exhausted, performance drops off in a way that a simple percentage-based alert would never have warned you about. The same goes for queuing. If processes are piling up waiting for CPU time, that queue length is often a leading indicator of trouble, showing up before utilization itself looks alarming.
The traditional path here involves picking a tool like Nagios or Zabbix, and before you even get to monitoring anything, there's a setup phase. You need a server to run the monitoring tool itself, then you need to install an agent or plugin on every machine you want to watch, configure how that agent reports back, and only after all of that is done can you start defining actual CPU thresholds and alerts. It works, but it's a real project, and for teams managing more than a handful of servers, that setup overhead is often the reason CPU monitoring gets pushed down the priority list.
With Bigbell, the process collapses down to a few steps. You log in to the console and connect your account, either by providing cloud credentials for AWS, GCP, or Azure, or, if you're running your own on-premises Linux box, by executing a single script that starts sending data back. From there, you go to add a monitor, and Bigbell shows you a library of available plugins. Type in what you're working with, Linux, AWS EC2, a GCP VM instance, an Azure virtual machine, and it asks for the relevant details and then shows you the servers available to monitor. Pick the one you want, and you can set CPU-related alerts right there, no separate agent installation, no dedicated monitoring server to stand up first.
The most common mistake is treating CPU monitoring as just a utilization percentage check and stopping there. A flat threshold like "alert me at eighty percent" is a reasonable starting point, but it misses the more useful signals. On burstable cloud instances, ignoring CPU credit balance means you can get blindsided by a performance drop that utilization alone never flagged, since the server can look fine right up until the moment the credit balance runs out.
Another common mistake is ignoring queue length. A server with moderate CPU utilization but a growing queue of processes waiting their turn is telling you something utilization alone won't, that demand is starting to outpace capacity even if the percentage number hasn't crossed an alarming threshold yet. Watching only the headline utilization number and skipping credits and queuing is like checking a car's speedometer while ignoring the fuel gauge and the engine temperature. Each one alone gives you a partial picture, and the failures that matter tend to hide in whichever one you weren't looking at.
A third mistake is setting a single static threshold across every server, regardless of what that server actually does. A database server and a lightweight web server have very different normal ranges, and a threshold tuned for one will either fire constantly on the other or miss real problems entirely.
Bigbell's CPU monitoring is built around the same setup ease described above, but the alerting itself goes past a flat utilization number. Because it's watching the full picture on cloud instances, including CPU credit balance where relevant, and tracking queuing behavior alongside raw usage, it can flag the kind of early warning signs that a basic percentage-only check would miss entirely. You're not just told the CPU is busy, you get visibility into why, whether it's genuine sustained load, a credit balance running low on a burstable instance, or requests backing up in a queue before utilization itself looks severe.
Because this runs alongside Bigbell's broader server monitoring, CPU alerts don't live in isolation either, they sit next to memory, disk, and process-level data for the same server, so when something does trip an alert, you already have the surrounding context instead of one number in a vacuum.
Is CPU utilization percentage enough to monitor on its own? Not really. It catches sustained heavy load, but it misses burstable-instance credit exhaustion and queuing buildup, both of which can precede a real problem while the utilization percentage still looks acceptable.
What are CPU credits and why do they matter? On burstable cloud instance types, credits govern how much CPU burst capacity is available beyond the baseline. A server can look fine on a utilization graph while running low on credits, and once they're exhausted, performance gets throttled, which is why credit balance needs its own visibility, not just utilization percentage.
Do I need to install an agent on every server to monitor CPU with Bigbell? For cloud instances, no, connecting your AWS, GCP, or Azure credentials is enough for Bigbell to discover and monitor servers automatically. For an on-premises Linux box, a single setup script handles it instead of a separate agent installation process.
If you're setting up monitoring more broadly, it's worth pairing this with our guides on setting up Linux server monitoring and the Windows server monitoring checklist. You can see the full CPU monitoring capability on the Bigbell Monitoring page.