Published Sept. 21, 2026
Most teams think they're monitoring uptime when really they're just pinging a server and calling it a day. The server responds, the ping succeeds, everyone assumes the application is healthy. Then a customer reports the checkout page has been throwing errors for the last twenty minutes, and it turns out the server was never the problem. The database connection pool was exhausted, or Redis was unreachable, and nobody found out until someone complained. That gap between "the server is up" and "the application actually works" is where most uptime monitoring quietly fails.
A server can be running perfectly and still be useless to your users. The operating system is fine, the process is alive, CPU and memory look normal, and yet the application layered on top of it is broken because a dependency underneath it isn't responding. This happens more often than people expect, because the failure isn't in the thing you're checking, it's in something that thing depends on.
The fix for this is building a proper health check URL, and it's worth being precise about what "proper" actually means here. A lot of teams build a health check endpoint that does nothing more than confirm the web server process is alive and return a response. That's better than nothing, but it doesn't tell you anything about whether the application can actually do its job.
A real health check endpoint should go further. It should verify that the database connection is working, that Redis or whatever caching layer you're using is reachable, and that any other critical backend components the application depends on are actually responding. When that endpoint returns a response code of two hundred, it should mean something specific: not just "the web server is alive," but "I checked the database, I checked Redis, I checked the other components this application needs, and all of them are working." That's a fundamentally more useful signal than a bare ping, because it tells you the actual dependency chain is intact, not just the front door.
This is the piece most teams miss. They build the health check endpoint once, early in the project, when there isn't much to check yet, and then never revisit it as the application grows more dependencies. Two years later, the health check still only confirms the web server is running, while the application has since grown to depend on three additional services that the health check knows nothing about.
Here's what an uptime monitoring setup actually needs to cover, item by item.
First, monitor the health check URL itself, not just the homepage or a random page on the site. The homepage might load fine from a cache even while the backend is broken, which gives you a false sense of security. The health check endpoint, built the way described above, is a much more honest signal.
Second, check the response code, and be specific about what you're looking for. A response code of two hundred from the health check endpoint should mean everything downstream checked out fine. Anything else, whether that's a five-hundred-series error, a timeout, or no response at all, is a signal that something in the backend chain has broken, and you want to know about it immediately rather than discovering it from a support ticket.
Third, track response time, not just whether the endpoint responds at all. This is a detail a lot of monitoring setups skip, and it's a mistake, because a slow response is often the earliest warning sign you get before something fails outright. If your health check normally responds in a couple hundred milliseconds and it starts consistently taking several seconds, that's usually a sign some component in the backend, maybe the database, maybe an external API call, is struggling under load or degrading before it fully fails. Catching that slowdown early gives you time to act before it turns into a full outage.
Fourth, set a threshold for what counts as acceptable response time for your specific application, and alert when it's exceeded. There's no universal number here, a couple hundred milliseconds might be fine for one application and completely unacceptable for another, so this needs to be tuned to what's actually normal for your setup.
Fifth, watch for unexpected content changes on key pages, not just availability. A page can return a perfectly healthy response code while showing the wrong content, an error message rendered inside an otherwise successful page load, or a broken layout that a status-code check alone would never catch. Content-change detection catches this category of failure that pure uptime checks miss entirely.
Sixth, check from multiple geographic locations if your users are spread out. A site that's reachable and fast from one region can be timing out or painfully slow from another, and you won't know unless you're actually checking from where your users are.
Seventh, make sure the alerting is fast enough to matter. A monitoring check that catches a problem but only notifies someone twenty minutes later isn't much better than not catching it at all. Speed of detection and speed of alerting have to move together.
None of these checks alone tells the whole story. Response code alone can miss a slow, degrading backend that hasn't failed outright yet. Response time alone can miss a case where the endpoint returns a two-hundred with completely wrong content behind it. It's the combination of a properly built health check, response code monitoring, response time tracking, and content-change detection that actually gives you a complete picture of whether your application is healthy, not just whether the server is technically running.
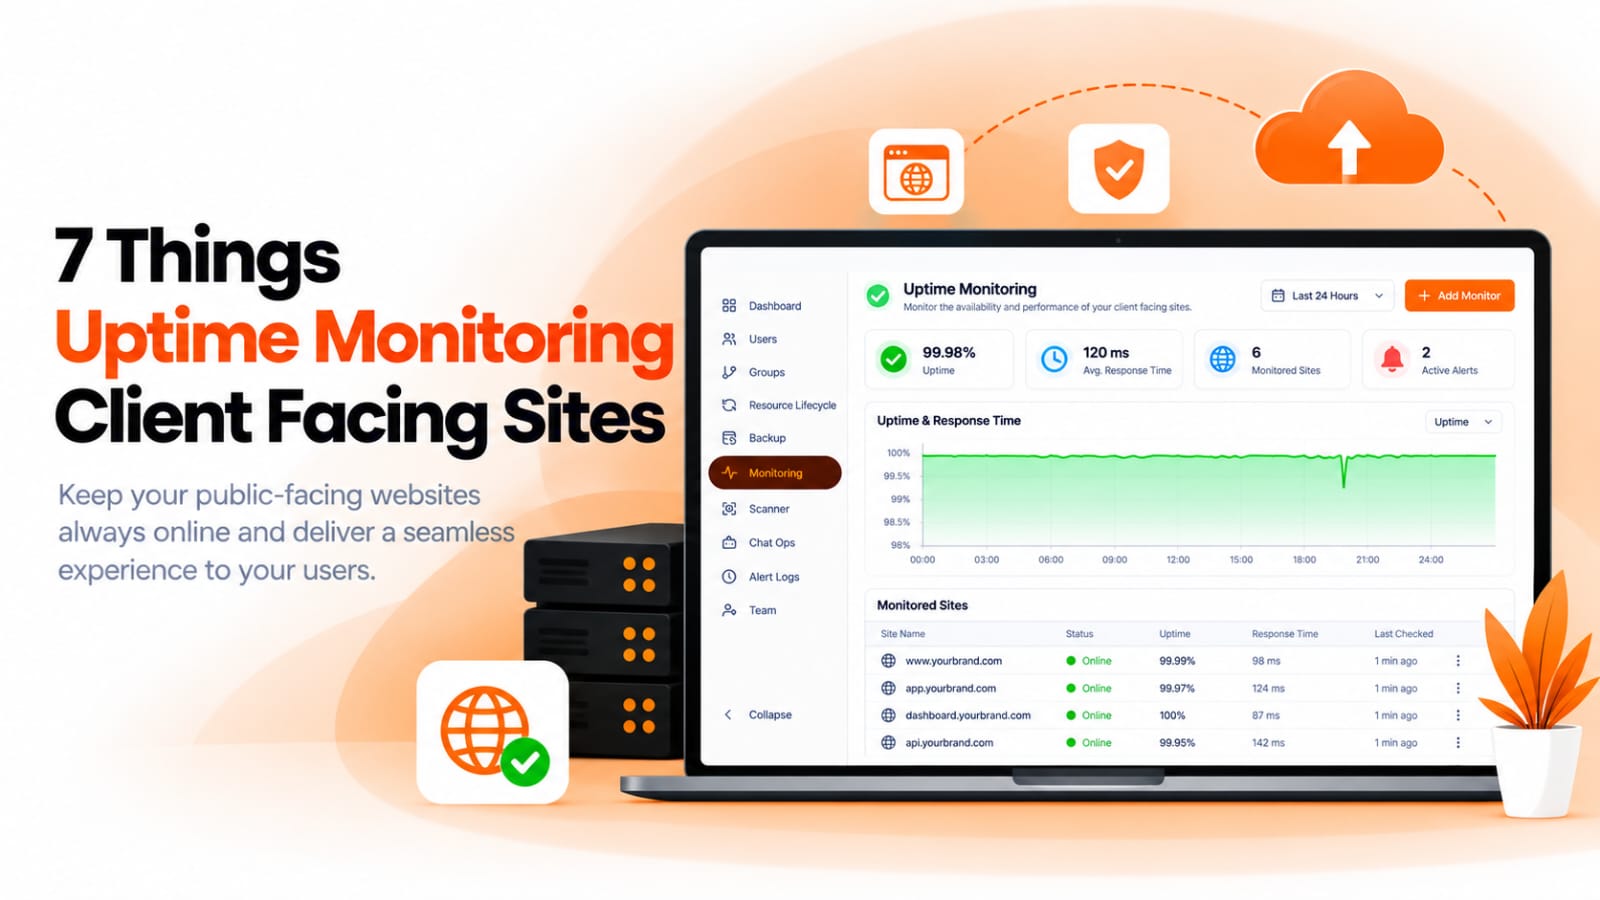
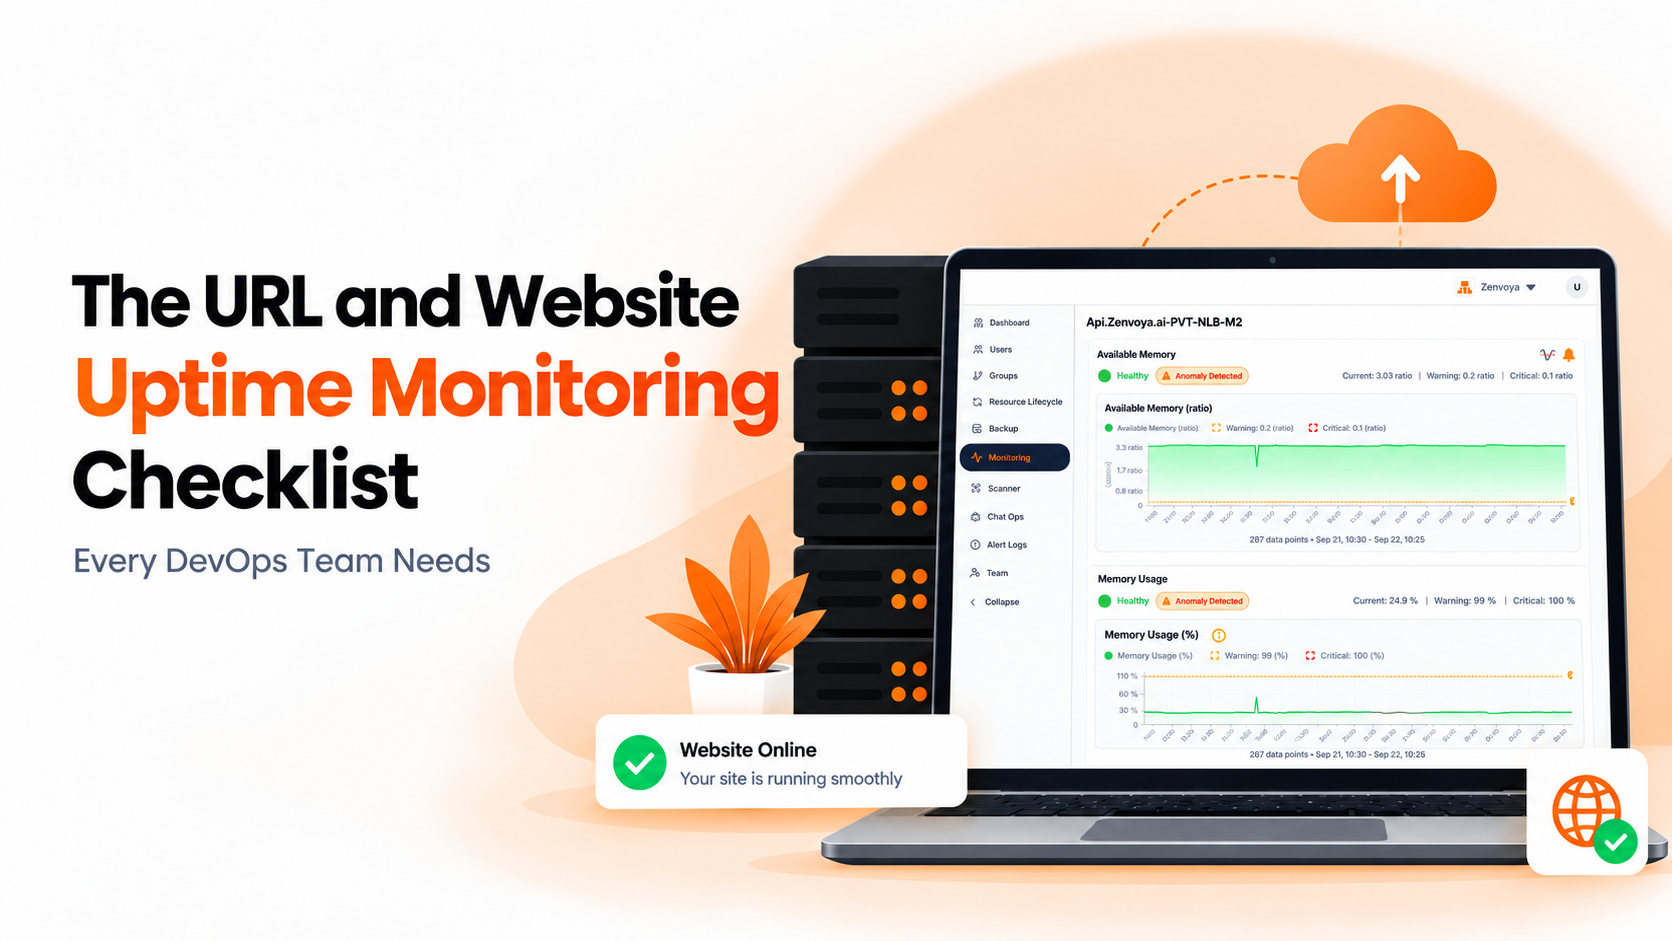
This is exactly the gap Bigbell's URL monitoring is built to close. It checks response codes so you know immediately if a health check endpoint stops returning two hundred, it tracks response time so you catch backend slowdowns before they become outright failures, and it detects unexpected content changes on monitored pages, so a broken deployment or a silently failing dependency doesn't slip through just because the status code still looks fine. All of it runs continuously, with alerts that reach you as soon as something crosses the line, instead of waiting for a customer to notice first.
If you're setting this up alongside server-level monitoring, it's worth pairing URL monitoring with the server monitoring covered in our guides on setting up Linux server monitoring and the Windows server monitoring checklist, since server health and application health are related but genuinely different problems, and catching one doesn't guarantee you'll catch the other.
You can see the full Bigbell Monitoring feature set on the Bigbell Monitoring page.