Published March 5, 2024
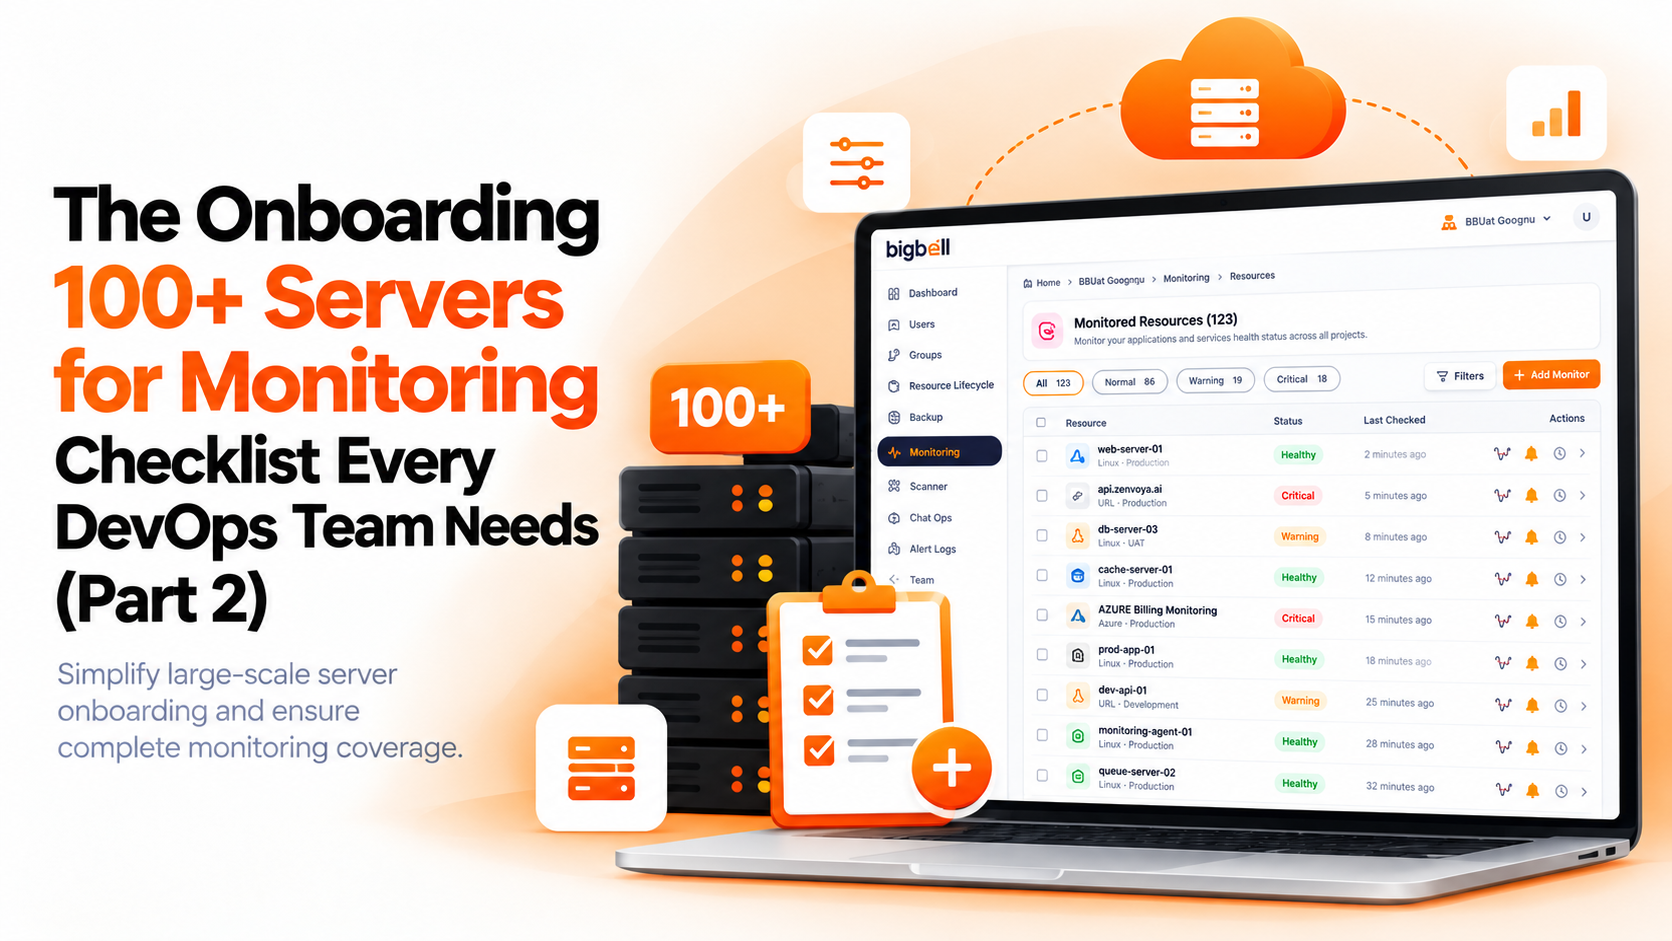
Adding one server to monitoring takes a few minutes and some care. Adding a hundred takes a different kind of discipline. Teams that skip it end up with a familiar pattern: the first thirty servers are set up carefully, the next fifty are copied in a hurry, and the last twenty are forgotten. Months later a disk fills on a machine nobody listed, and the dashboard looks green because it only shows what was added.
Good server monitoring onboarding at this size is mostly about order and consistency. This checklist covers the steps in the order that saves the most work, explains why each matters, and shows what Bigbell can do to reduce the effort.
The inventory is the only way to know when you are finished. Without it, "all servers" means whatever you happened to remember.
Naming and grouping decide how much work you do later. If servers are grouped by environment or product, one change to a threshold reaches the whole group. If they are loose, every change is a hundred edits.
Waves keep the project safe. Starting with critical and similar servers delivers value early and teaches you which settings need adjusting before they are repeated at scale.
Choosing the collection method matters more as the count grows. An agent shows detail inside the server, but needs installation on every machine. Cloud account metrics need no installation but show less. External checks see what users see.
Thresholds set per group prevent drift. At scale, one wrongly set value, repeated across forty servers, produces forty false alarms. Test the values on the pilot wave first, and tighten them for production over test.
Routing set per group prevents the most common failure of large setups: alerts that reach nobody. Each group should point to a team that owns it, in a tool that team actually reads.
The pilot protects your on call team. Noisy alerts on day one teach people to ignore alerts.
Reconciliation is the step most teams skip. Compare the monitored list against the inventory, and investigate every difference. New servers, renamed servers, and removed servers all create gaps.
Testing a sample from every group proves that the routing works end to end.
Regular review keeps the setup honest, because owners change and servers come and go every week.
Bigbell does not onboard a hundred servers with one click. We have not verified a bulk onboarding feature, a feature that starts monitoring newly created servers automatically, or a reusable template that applies a standard setup to many servers. What it does offer is a way to do the group level steps once.
For grouping, monitoring is organized into projects and applications, and tags help with filtering. For thresholds, Bigbell provides warning and critical levels with defaults, and you can override them at the project or application level, so one change can cover a group. Some defaults are loose. For example, CPU and memory percent default to 99 and 100, so review them. For routing, alerts can be sent by organization, project, plugin, or application to email, Slack, Microsoft Teams, Google Chat, WhatsApp, SMS, and calls, and communication channels have verification steps that support the testing item.
For collection, there are three routes. You can connect a cloud account for AWS, Azure, or Google Cloud metrics. You can use a bridge, which discovers the servers in an AWS environment, lists them for you, and installs Bigbell's Linux monitoring agent through a remote plugin installation. When the discovery runs again, new servers are added to the bridge's list and servers that no longer exist are removed, which helps with reconciliation. Whether the agent installation runs across many servers in one action is not something we have verified. A standalone setup is available for Linux systems outside a bridge. And you can add website or application addresses for external checks of availability, response time, certificate expiry, and content changes.
Know the limits. The server agent is for Linux, and Bigbell has no Windows agent. Discovery through the bridge is for AWS. Bigbell does not compare your monitored list against an inventory you keep elsewhere, so reconciliation remains your task.
Try Bigbell free to see how a first wave of servers is brought into monitoring.
What is server monitoring onboarding? The steps that bring servers into monitoring, from inventory to alert testing.
Why is onboarding 100 servers different from one? Consistency matters more. Mistakes repeat across every server.
Where should I start? With an inventory of every server, its owner, and its environment.
Does Bigbell onboard many servers at once? We have not verified a bulk onboarding feature.
Does Bigbell monitor new servers automatically? We have not verified that.
Can Bigbell discover my servers? Yes, for AWS, through a bridge that lists the servers it finds.
Does discovery remove old servers? Yes. Servers that no longer exist are dropped from the bridge's list when discovery runs again.
Does Bigbell have a Windows agent? No. Its server agent is for Linux.
Can I set thresholds for a group? Yes. You can override defaults at the project or application level.
Are the default thresholds safe? Not always. CPU and memory percent default to very high values, so review them.
Which channels can receive alerts? Email, Slack, Microsoft Teams, Google Chat, WhatsApp, SMS, and calls.
Can I monitor a server without installing an agent? Yes, through cloud metrics or external checks, with less detail.
How big should the first wave be? Small enough to review by hand, and similar enough to reuse its settings.
How do I reconcile monitored servers with my inventory? Compare the two lists regularly and investigate every difference.
How often should I review the setup? At least monthly, and after large changes.
Should every server get the same thresholds? No. Set them per group, with stricter values for production.
Should I test every server's alerts? No. Test a sample from every group.
What if a server is missing from the inventory? Add it, assign an owner, and place it in a group before onboarding it.
Who should own onboarding? A named person or team, so every new server follows the same steps.