Published Jan. 15, 2024
A small engineering team starts on AWS, adds a couple of Azure VMs for a client project, then spins up GCP for a data pipeline six months later. Nobody sits down and designs this — it just happens, one reasonable decision at a time. Each cloud ships its own console, so the team ends up with three logins, three sets of alerts, and one habit: whichever dashboard someone happens to check most is the one that "looks fine." Then a database connection pool fills up on the Azure VM nobody was watching, and it's two hours before anyone notices, because nobody's job was to watch that particular screen.
This is the real shape of the problem behind most saas server monitoring gaps. It's rarely that a team has no monitoring at all — it's that monitoring is scattered across whatever each provider happens to bundle in, and nothing actually looks at the whole picture at once.
Native cloud consoles feel free, because they come bundled with the account. Paying for a dedicated monitoring platform feels like an unnecessary expense right up until the moment it clearly isn't. That math rarely gets revisited until an incident forces the conversation.
Multi-cloud sprawl also happens gradually, not all at once. A second cloud provider gets added for one project, then a third for another reason entirely, and nobody goes back to ask whether the monitoring setup still makes sense for three providers instead of one. Ownership follows the same pattern — whichever team added a resource assumes they're responsible for watching it, and that assumption quietly breaks down as people move between projects.
Evaluating and switching to a proper monitoring platform also just isn't urgent, ever — until it suddenly is. It competes with feature work for the same hours, and feature work has a deadline attached to it while "better monitoring" doesn't.
The most direct cost is blind spots between providers. Whichever cloud gets checked least often is where an incident runs longest before anyone notices, simply because nobody's routine includes that console.
Alerting quality also gets inconsistent across a scattered setup. Some resources get real thresholds tuned by someone who cared; others sit on whatever default the platform shipped with, or have no alerting configured at all. During an actual incident, that inconsistency means the team doesn't know how much to trust silence from any given system.
There's a real time cost too — context-switching across three consoles while diagnosing one incident, instead of working from a single place that already has the data. And two things drift quietly in the background the whole time: cloud spend, which rarely gets watched as closely as uptime, and basic security hygiene — an open port, a database without deletion protection, a server with no backup — that nobody catches until an audit or, worse, a breach.
Consolidate onto one platform that watches compute, uptime, and cost across every provider actually in use, instead of stitching together whatever each cloud's own console happens to offer. This alone removes the "which dashboard was I supposed to check" problem.
Set thresholds against how each resource is actually used, not one blanket default applied across an entire multi-cloud estate — a database server and a lightly used staging box shouldn't share the same CPU limit. Build in a short delay before anything alerts, so a brief spike doesn't get treated the same as a genuine outage, and make sure a recovery notification goes out too, so nobody's left manually re-checking.
Route each alert to whoever actually owns that resource, not a shared inbox everyone assumes someone else is watching. And treat security and cost review as a routine part of monitoring, not a separate task that only happens during an annual audit.
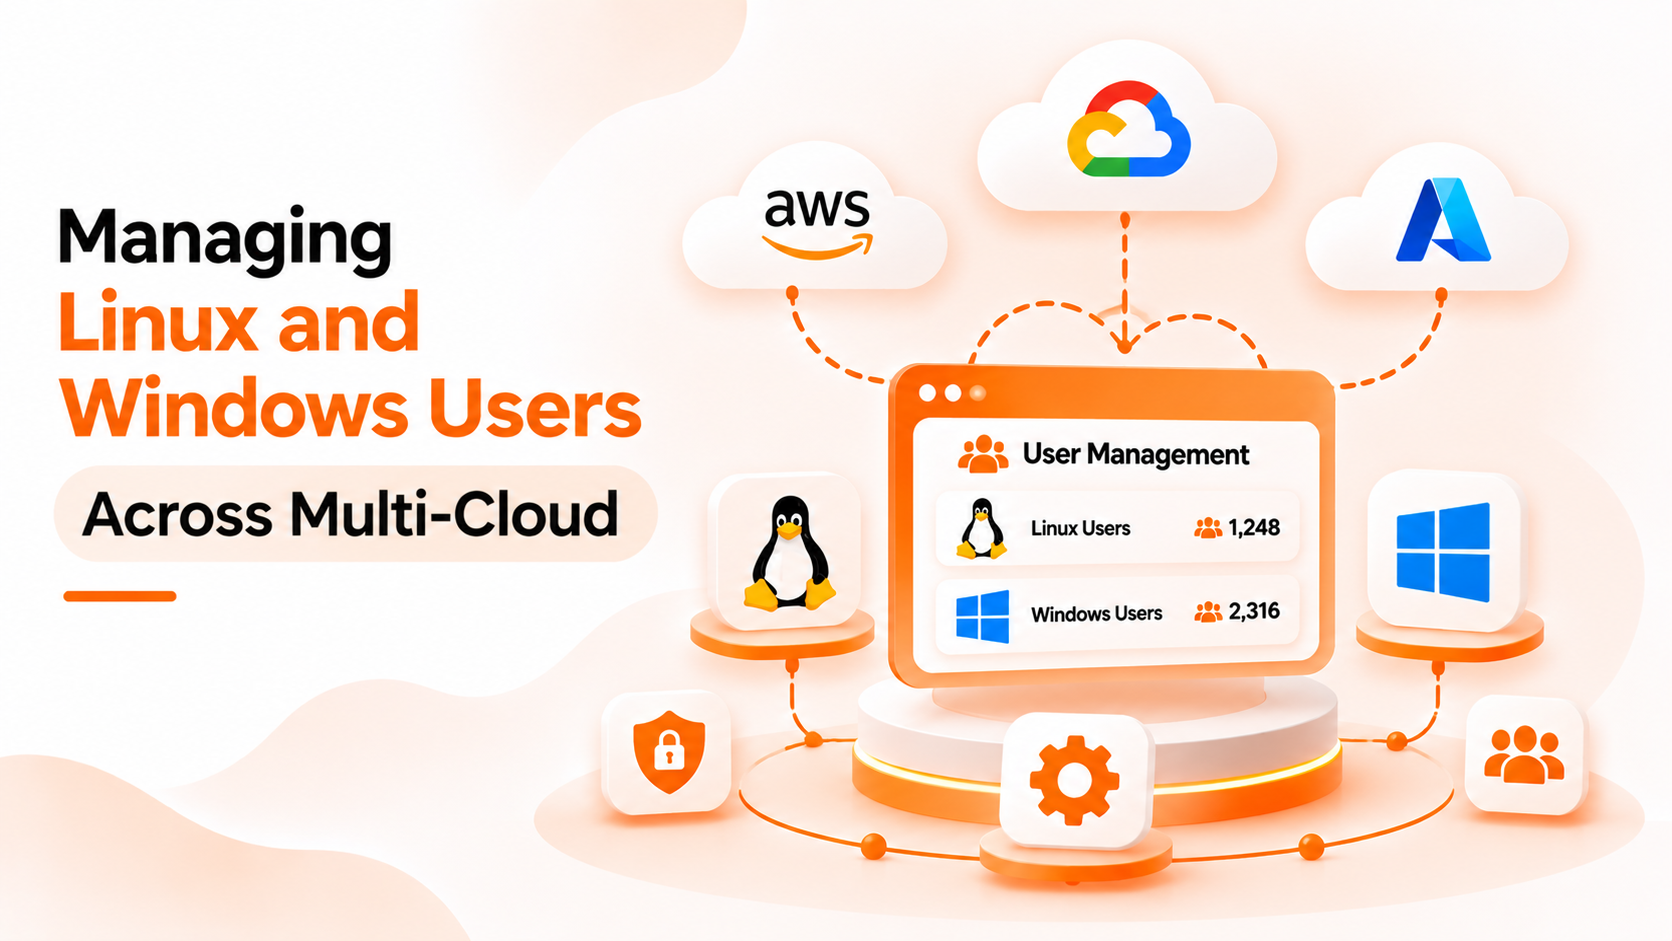
BigBell's monitoring covers compute across three providers from one place — AWS EC2 instances via CloudWatch, Azure virtual machines via Azure Monitor, and Google Compute Engine instances via Google Cloud Monitoring — pulling real CPU, memory, and disk activity metrics rather than requiring three separate native consoles. For anything else, including servers that aren't hosted on any of these three clouds, a lightweight Linux agent reports the same CPU, memory, and disk data directly.
Alongside compute, BigBell's URL monitoring checks uptime and response time from outside any given cloud's own network, and tracks SSL certificate expiry on its own schedule. Cloud spend is monitored too — real billing data pulled from AWS Cost Explorer, Azure Cost Management, and GCP's billing export, with thresholds for current-month cost and month-over-month increases, so a spend spike gets flagged the same way a performance spike would.
Automated insights scan connected accounts for common security and configuration gaps — open sensitive ports, EC2 instances without termination protection, databases without deletion protection or Multi-AZ, and resources with no backup configured — plus resource utilization patterns like servers running consistently over- or under-provisioned. Every threshold can be set per resource, alerts carry a configurable delay before firing, and routing works at the organization, project, or application level, reaching your team over email, Slack, Microsoft Teams, Google Chat, WhatsApp, SMS, or a phone call.
Book a demo and see your entire multi-cloud setup from one place.
Does BigBell monitor more than one cloud provider from a single dashboard? Yes. AWS EC2, Azure VMs, and Google Compute Engine instances are all monitored from the same platform, alongside any Linux server regardless of where it's hosted.
Does this replace my cloud provider's native console? Not entirely, and it doesn't need to. Native consoles remain useful for provider-specific configuration; BigBell's role is pulling the metrics and alerts that matter into one consistent place instead of three, so day-to-day monitoring doesn't depend on remembering to check each one.
What happens if I add a second or third cloud provider later? The same setup extends to it. Compute metrics, thresholds, alert delay, and routing all work the same way across AWS, Azure, and GCP, so growing from one provider to several doesn't mean rebuilding monitoring from scratch.
Can it track cloud spend, not just server performance? Yes. Billing is monitored across AWS, Azure, and GCP, with thresholds for current-month cost and month-over-month increases, so unusual spend gets flagged rather than discovered at the end of the month.
Will connecting everything flood the team with alerts? Not by default. Thresholds are set per resource rather than one global setting, and a configurable delay means a brief spike has to persist before it counts as a genuine issue.
Does BigBell check for security misconfigurations too? Yes, for connected cloud accounts. Automated insights flag things like open sensitive ports, missing termination or deletion protection, and resources without backups configured.
Do I need separate tools for uptime, cost, and security checks? No. All three are part of the same platform, which is largely the point — a scattered set of single-purpose tools is exactly what tends to get ignored until something in the gap between them breaks.
Is this only useful for teams already running multiple clouds? No. Even a single-cloud team benefits from having compute, uptime, cost, and security checks in one place instead of split across a native console and separate point tools — the multi-cloud case just makes the gap more obvious, sooner.