Published Feb. 5, 2024
Every engineering team eventually encounters the dreaded late-night outage. A root partition fills silently, a memory leak exhausts system buffers, or an unindexed query spikes CPU usage to 100 percent. By the time customer reports arrive, production services are already down.
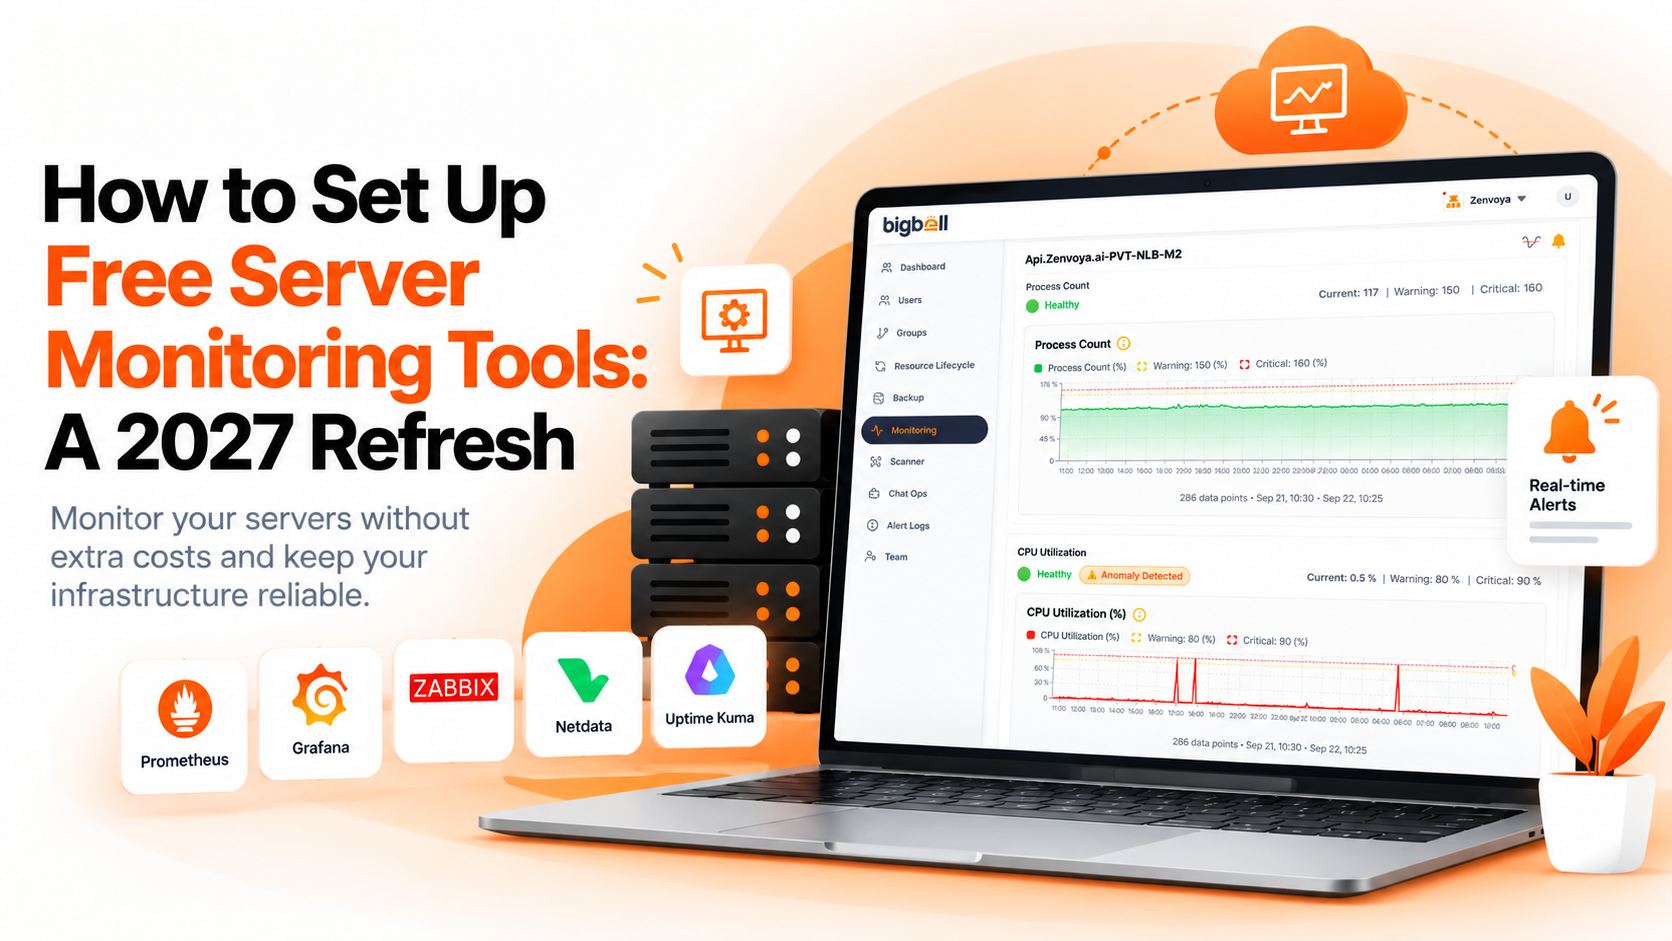
To prevent downtime, engineering teams turn to free server monitoring. Whether deploying open-source metrics tools or configuring lightweight telemetry scripts, free server monitoring delivers essential visibility into system health without steep software licensing fees.
However, setting up free server monitoring tools often brings friction. Teams frequently spend days configuring complex exporter daemons, wrestling with brittle cron schedules, securing exposed endpoints, and battling noisy alerts from harmless transient spikes. Building a dependable observability foundation requires a clear, practical implementation strategy.
System availability directly impacts user trust and operational stability. Deploying a dedicated free server monitoring workflow provides several key advantages:
Establishing a functional free server monitoring pipeline requires a structured approach across metric definition, agent deployment, and alerting.
Focus on essential Linux operating system counters rather than collecting noisy metrics:
Install an open-source collector or lightweight telemetry script on your Linux host. Tools like Prometheus Node Exporter expose kernel metrics, while custom Python scripts using psutil gather stats on a scheduled Linux cron interval.
Transport collected metrics to a central endpoint via push or pull methods:
Establish two distinct alerting tiers to avoid notification fatigue:
Plot collected time-series data on visual trend graphs. Connect alert webhooks directly into operational channels like Slack or email lists so teams notice issues promptly.
Even experienced teams make errors when implementing free server monitoring tools:
While assembling custom scripts or hosting self-managed monitoring stacks offers flexibility, maintaining that infrastructure requires continuous manual effort. BigBell simplifies this process through automated, reliable infrastructure monitoring.
Through BigBell's streamlined monitoring capabilities, teams eliminate manual collector maintenance with two flexible setup options:
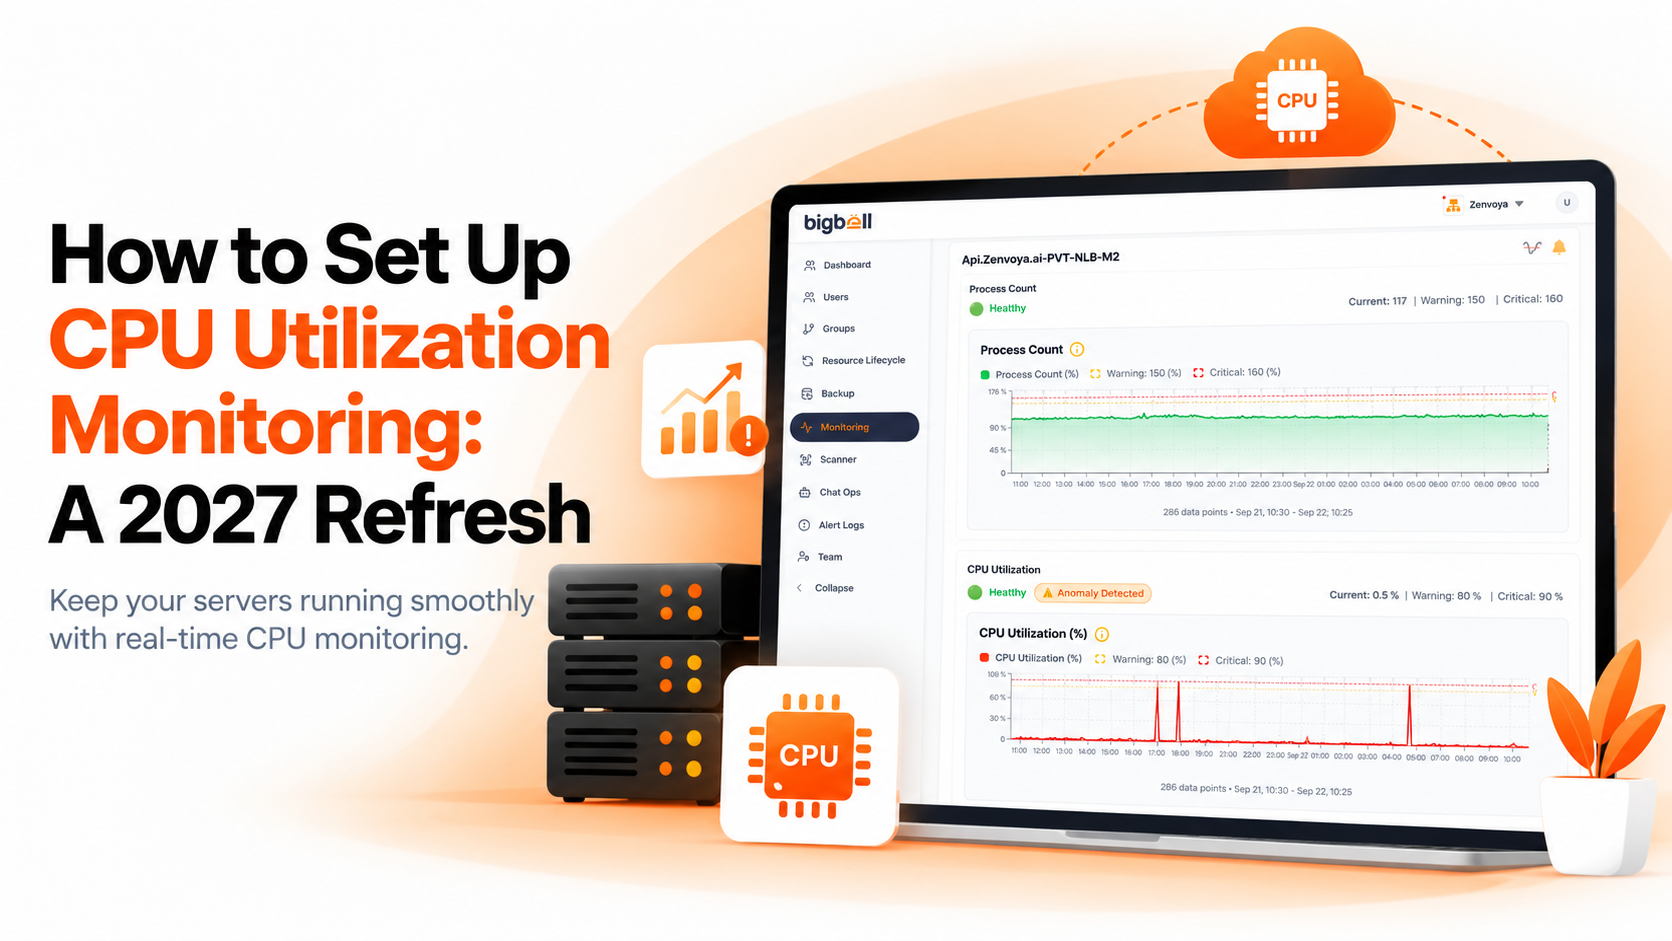
BigBell automatically visualizes vital server health metrics:
To eliminate false alarms, BigBell pairs customizable warning and critical thresholds with configurable alert delay settings (such as a 10-minute grace window). When genuine issues occur, BigBell dispatches alerts across your team's preferred channels—including Slack, Microsoft Teams, Google Chat, Email (Gmail / Amazon SES), WhatsApp, SMS, and Phone Calls.
Eliminate fragile monitoring scripts and noisy alert channels. Book a demo to explore how BigBell streamlines Linux server monitoring with clean dashboards and multi-channel alerting.
What is free server monitoring? Free server monitoring refers to tracking physical or virtual server health and availability using open-source utilities or free-tier monitoring platforms. It collects fundamental operating system telemetry—such as CPU utilization, memory allocation, storage space, and running processes—to detect performance bottlenecks and prevent downtime without software licensing costs.
What is the ideal polling frequency for server monitoring? For standard production workloads, collecting metrics at a 1-minute to 5-minute interval provides the right balance between metric accuracy and low system overhead. Polling more frequently than once per minute rarely offers additional diagnostic value for general operating system metrics while consuming unnecessary disk I/O and processor cycles.
How does standalone server monitoring differ from a bridge setup? In a standalone monitoring setup, collection agents are configured individually on single Linux instances, transmitting performance metrics directly via isolated SSH or HTTPS requests. A bridge setup utilizes a centralized collector node to manage multi-server discovery, automate agent configuration across multiple hosts, and centralize metric forwarding, minimizing administrative overhead across server fleets.
Why are alert delay settings important for server metrics? Alert delay settings enforce a brief evaluation window (such as 5 to 10 minutes) before an alert is dispatched. Because routine operations like package updates, backups, or service restarts cause short-lived CPU or memory spikes, alert delays ensure engineers are only notified when a threshold violation is sustained and indicates an actual operational problem.
What channels should teams use for server monitoring alerts? Teams should align notification channels with incident severity. Informational updates and minor warning thresholds work best inside collaborative workspaces such as Slack, Microsoft Teams, or Google Chat. Critical production alerts—such as severe memory starvation or an impending disk failure—are best routed to direct, high-visibility channels including SMS, automated phone calls, or priority email.
Can free server monitoring track disk inode consumption? Yes, robust monitoring tools track both raw disk storage capacity and file system inode usage. Inodes represent data structures used to store file metadata on Linux file systems. When an application generates a massive volume of tiny files or temporary logs, inodes can run out even when significant disk space remains, causing system write failures unless properly monitored.