Published Nov. 15, 2023
It's a familiar Monday morning. Your production API is on AWS, your data pipeline runs on GCP, a partner integration lives on Azure because that's what the client's compliance team required, and a couple of lightweight app servers sit on DigitalOcean because someone needed them up fast two years ago. Nobody planned this spread — it happened one project at a time. Then one Monday, checkout starts failing. It takes forty minutes and four browser tabs to figure out the actual cause was an expired SSL certificate on a server nobody had checked in months.
This is what multi-cloud server monitoring actually looks like for most growing teams: not a strategic decision, but a byproduct of normal growth, and a blind spot that stays invisible right up until it costs you.
Every cloud provider ships its own monitoring console — CloudWatch, Azure Monitor, Google Cloud Monitoring, DigitalOcean's own dashboard. Each one is fine in isolation. The problem is that nobody's job is to check all four every day, so each dashboard quietly becomes someone's "I'll look at it later" tab.
Ownership is usually just as scattered as the infrastructure. The AWS account was set up by one engineer, the GCP project by a data team, the Azure resources by whoever handled that one enterprise deal, and the DigitalOcean droplets by whoever needed a quick server. Multi-cloud monitoring falls into the gap between teams, because it isn't clearly any one team's responsibility.
It also doesn't help that monitoring is usually configured once, at launch, and never revisited. Alerts that made sense for a three-server setup get ignored once you're running twenty, and a few false-positive pings train everyone to stop reading them altogether.
The immediate cost is downtime that customers find before you do — a support ticket, not a dashboard, is what tells you something is down. SSL certificates expire quietly and take checkout flows or partner API integrations with them. Backups that everyone assumes exist often don't, because nobody's confirmed a snapshot policy is actually attached to that instance since it was created.
There's a financial cost too. Cloud spend is scattered across separate billing consoles, so a runaway resource or an idle, oversized instance can run for weeks before anyone notices it on an invoice. And on the security side, a database or SSH port left open to the public internet on one provider can sit exposed indefinitely if nobody's routinely scanning across all of them.
None of this is dramatic on its own. It's the accumulation — a missed cert here, an unbacked-up instance there — that eventually turns into a bad week.
The fix isn't necessarily consolidating providers; it's consolidating visibility. A few practical habits help:
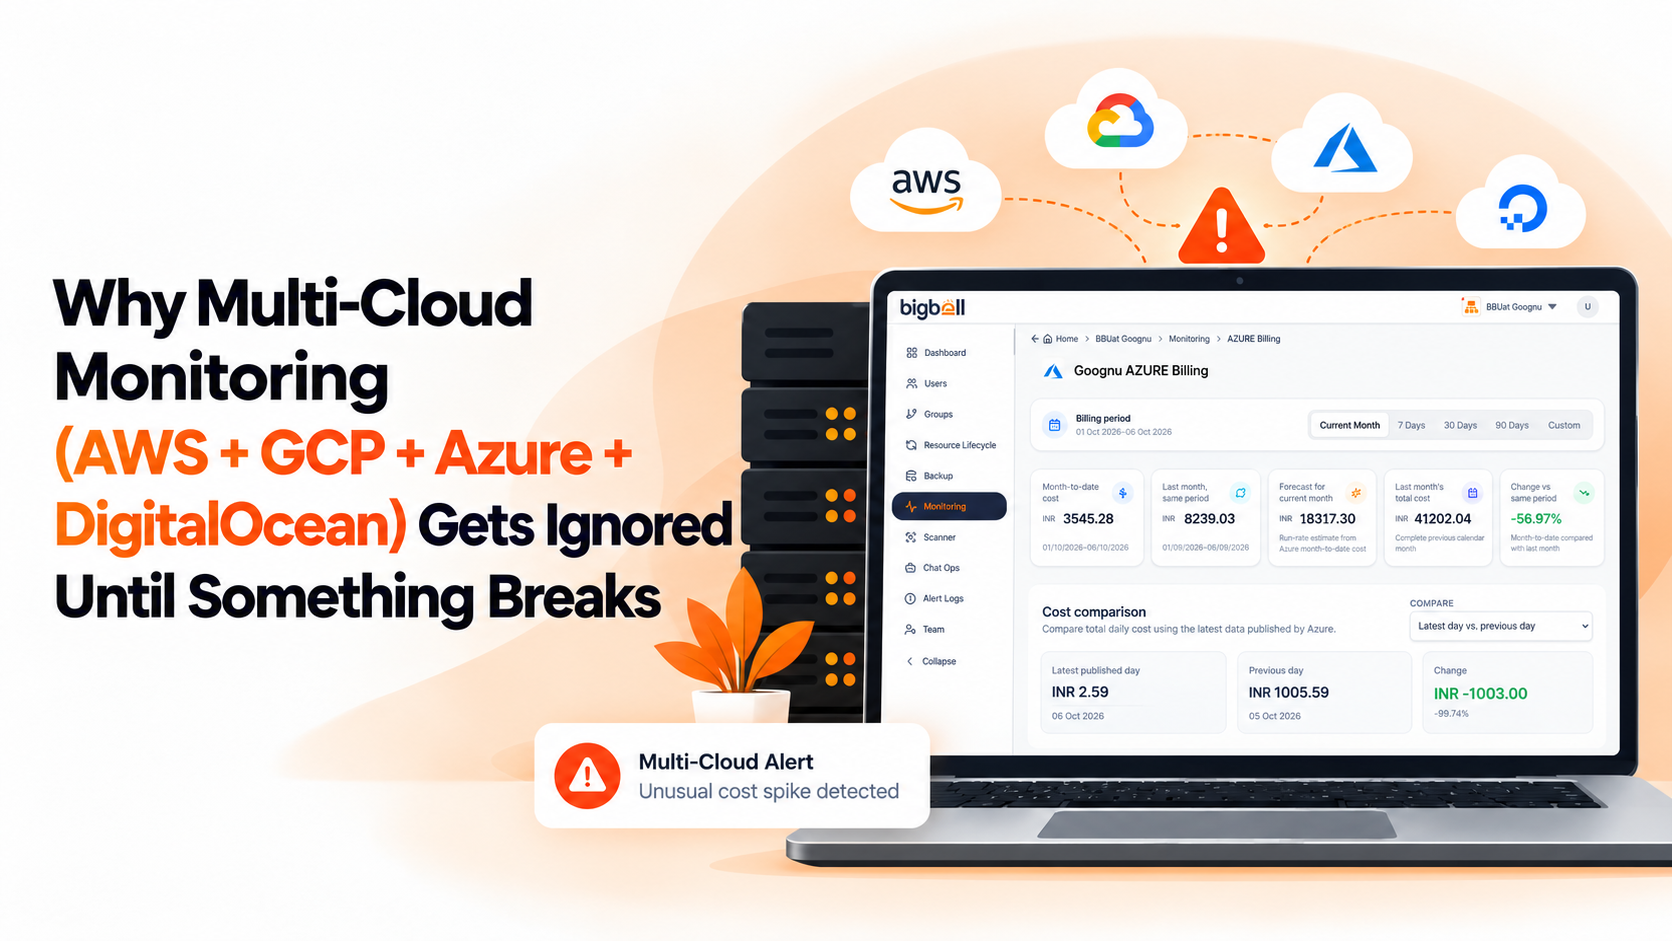
BigBell's monitoring platform is built around exactly this gap. For AWS, it monitors a wide range of services natively — EC2, RDS, Lambda, load balancers, S3, EBS, container and database services, and more — alongside AWS billing, so cost and resource health sit side by side. For Azure and GCP, BigBell tracks virtual machine health and pulls billing data directly from Azure Cost Management and GCP's billing export, giving you service-level cost breakdowns without logging into either provider's console.
For servers that don't have a dedicated cloud integration — including Linux instances running on providers like DigitalOcean — BigBell's lightweight monitoring agent reports CPU, memory, and disk usage the same way it does for AWS, Azure, and GCP hosts, and its URL and SSL monitoring checks any public endpoint regardless of where it's hosted. That's how a mixed fleet ends up on one dashboard instead of four.
Beyond metrics, BigBell runs automated checks that catch what manual reviews miss: EC2 instances without termination protection, RDS databases without deletion protection or Multi-AZ, instances with no backup on record, and sensitive ports left open to the public. Alerts use a configurable delay per project so a momentary blip doesn't page anyone, but a genuine outage does — and it can reach your team by email, Slack, Microsoft Teams, Google Chat, WhatsApp, SMS, or a phone call, whichever people actually respond to.
Not necessarily replacing them, but not checking each one separately either. The goal is a single view of server health, uptime, and cost across providers, so incidents surface in one place instead of requiring you to piece together four dashboards.
Not identically. AWS, Azure, and GCP have dedicated integrations for resource metrics and billing. For DigitalOcean and other hosts without a native integration, BigBell's server agent still tracks CPU, memory, and disk, and its URL/SSL checks cover any public endpoint — which is usually enough to bring those servers into the same view.
BigBell applies a configurable delay before marking something as down, so a momentary blip doesn't fire an alert while a genuine, sustained outage still does. The delay is set per plugin and per project, so a database connection that recovers in seconds isn't treated the same way as a web server that stays unreachable for minutes.
Both. Alongside metrics, BigBell's automated scans flag things like EC2 instances without termination protection, RDS instances without deletion protection or Multi-AZ, and databases or SSH ports left open to the public internet — the kind of gaps that usually only get found during a manual audit, if at all.
Most teams connect their first provider and get basic uptime, resource, and cost visibility running within a day; deeper checks like backup verification and open-port scanning can be layered in afterward as more providers are added.
Yes. Warning and critical thresholds are configured per plugin and per project or application, not applied globally, so a database on AWS and a VM on Azure can have thresholds that reflect how each is actually used rather than a one-size-fits-all default.
BigBell can schedule and track backups for AWS, Azure, and GCP instances with configurable retention (daily, weekly, or monthly), and its automated checks flag instances that don't have a backup on record at all — one of the more common gaps teams discover only after they need a restore.
Ready to see it working on your own infrastructure? Book a demo and we'll walk through monitoring your actual AWS, Azure, GCP, and other servers — not a generic sandbox.