Published May 5, 2024
A server can go from healthy to overloaded in minutes — a traffic spike, a runaway process, a disk filling up during a deploy. If the only thing watching is a dashboard someone checks once a day, or a script that runs on an hourly cron, the gap between "it broke" and "someone noticed" is exactly as long as the gap between checks. Skip proper real-time server monitoring, and every incident runs for however long it takes for a human to happen to look.
This checklist covers what an actual real-time setup needs, not just monitoring in name. None of it requires replacing your infrastructure — it's a way to see what's missing before the next slow-building incident finds it for you, whether that incident is on a single server or spread across your whole fleet.
Continuous metric collection. A dashboard you check manually only tells you what's true at the moment you happen to look. Continuous collection means CPU, memory, and disk data exist for every minute in between, not just the ones somebody remembered to check, so a slow resource leak shows up in the data long before it becomes an outage.
Every server, not just the obvious ones. It's common to watch the main production box closely and forget the smaller ones — a worker, a staging server, a cron host — until one of them runs out of resources and takes something down with it. Real-time monitoring only helps if it's applied consistently across the whole fleet, not just the servers that feel important.
External uptime and response time checks, run often. A server can look fine internally while the actual service is unreachable from the outside, due to a firewall rule or a crashed process. Checking from outside, and checking frequently, catches this before a customer does.
Cloud metrics from the provider's own data. A cloud VM has real performance data available through the provider's own monitoring service. Pulling that data directly, rather than guessing from the outside, is what makes cloud server monitoring genuinely real-time rather than a periodic approximation.
Thresholds tuned to catch problems quickly. A default CPU or memory threshold either fires constantly on a busy server or stays silent on one running close to its limits. Thresholds set against actual behavior — different for a database server than for a lightweight cron worker — are what make fast, frequent checks worth having instead of just noisy.
A short delay before alerts fire. Checking often is only useful if it doesn't also mean paging someone over a five-second blip. A brief delay lets a real problem confirm itself as real before anyone gets notified.
Recovery notifications. Knowing something broke is half the picture. Without a notification when it's back up, someone has to keep manually checking, which defeats the purpose of monitoring in real time in the first place.
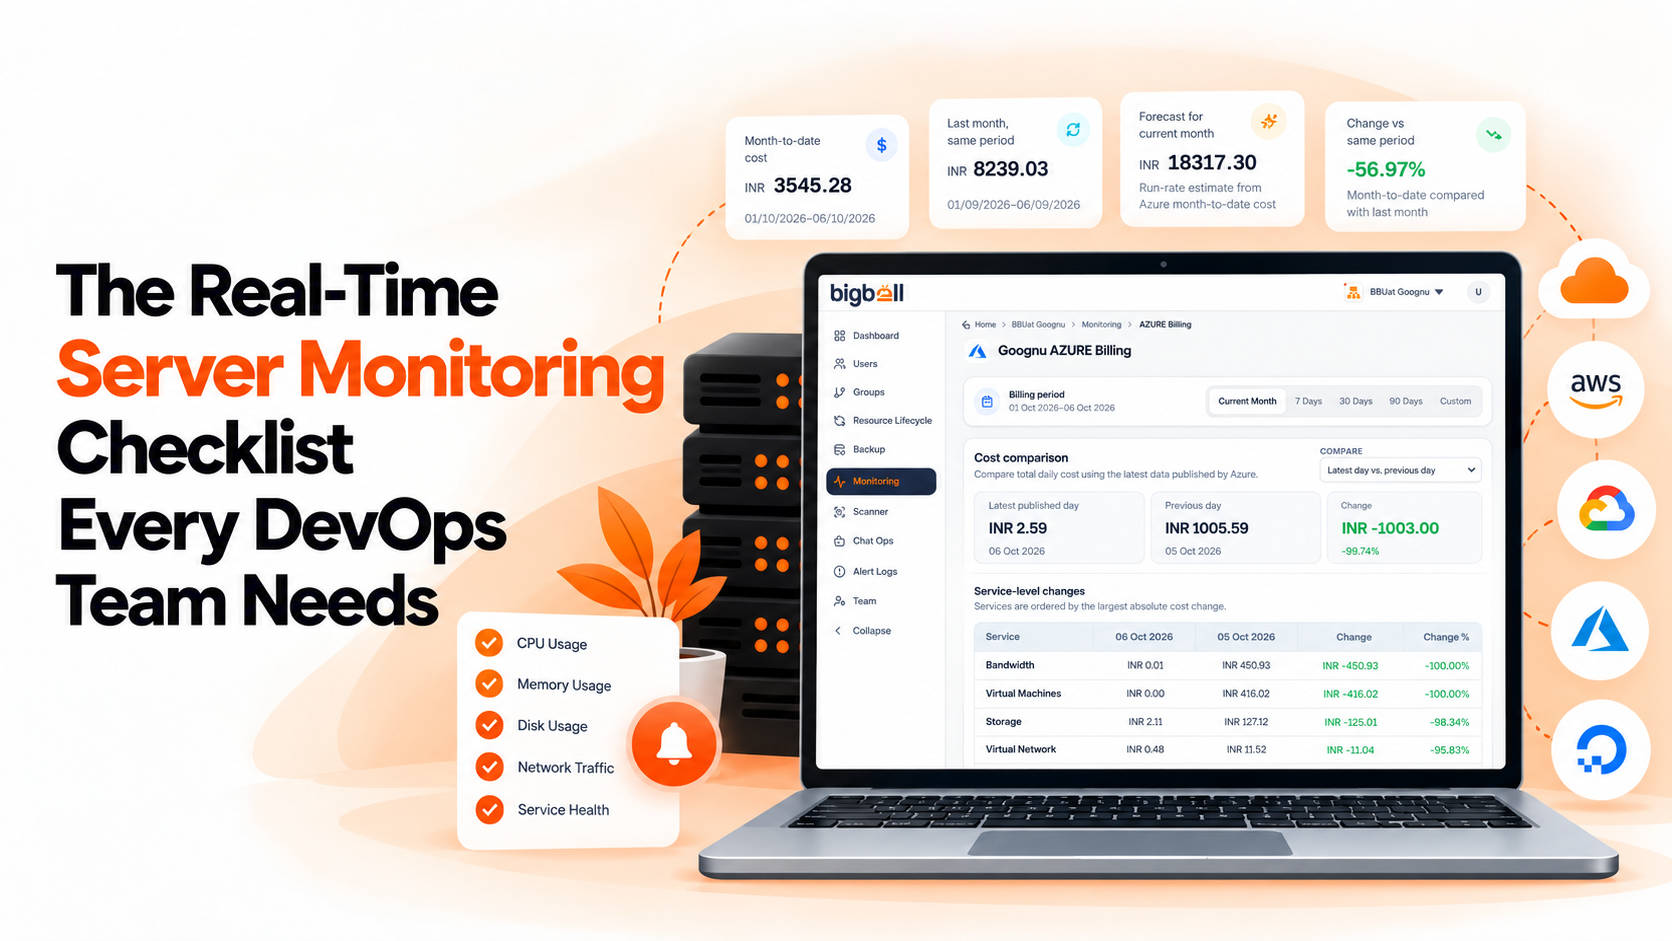
BigBell's server monitoring covers this checklist through a combination of a lightweight Linux agent and cloud-native metric collection. The agent runs as a background service on the server itself, continuously reporting CPU, memory, and disk usage, with a scheduled backup check every five minutes so data keeps flowing even if the main service has a hiccup. Check frequency for any monitored resource can be set anywhere from every few seconds up to once a day, depending on how closely a given server needs to be watched.
For servers running as cloud virtual machines, BigBell pulls performance data directly from the provider's own monitoring service — AWS CloudWatch, Azure Monitor, or Google Cloud Monitoring, depending on where the VM lives — rather than estimating it separately. BigBell's URL monitoring checks uptime and response time from outside your infrastructure on the same configurable schedule, the way a real visitor would reach the service.
Every threshold is set per server or application rather than one global default, and a configurable delay means a brief spike doesn't get treated as an outage, while a recovery notification goes out the moment things are healthy again. Alerts can be routed at the organization, project, or application level, so the right team hears about it rather than everyone at once, reaching your team by email, Slack, Microsoft Teams, Google Chat, WhatsApp, SMS, or a phone call.
Try BigBell free and see this checklist running against your own servers.
It means data is collected on a short, continuous schedule rather than checked periodically by hand. It doesn't mean instantaneous down to the millisecond — it means the gap between a problem happening and it showing up in your monitoring is minutes, not hours or days.
Check frequency is configurable per resource, from as often as every few seconds up to once a day, depending on how critical that particular server or service is. A production database usually warrants a much shorter interval than a rarely used internal tool.
Largely, yes, for the routine watching. Continuous monitoring is what catches the gradual drift and sudden spikes a human checking once a day would miss, though it doesn't replace occasionally reviewing overall trends or investigating an incident once you're alerted to it.
Not if a delay is built in. A configurable delay means a brief spike has to persist for a set period before it counts as a genuine issue, rather than paging someone for something that resolves on its own.
The data source is different. A cloud VM's metrics come directly from the provider's own monitoring service — AWS CloudWatch, Azure Monitor, or Google Cloud Monitoring, depending on where it runs — while a regular Linux server reports data through an installed agent instead. Either way, the data is tracked continuously and alerts work the same way once it's flowing in.
No, and it shouldn't. A database under constant load might need closer watching than a lightly used staging box, and frequency can be set differently for each.
Both. A recovery notification goes out once a server or service returns to a healthy state, so nobody has to keep manually checking whether an issue actually resolved.
On an installed Linux agent, a scheduled backup check runs every five minutes alongside the main background service, so a brief interruption in the primary reporting process doesn't leave a server completely unwatched in the meantime.