Published Oct. 5, 2023
Running production applications without visibility into processing capacity is a common gamble that engineering teams take until an outage forces a reckoning. The primary frustration teams hit with CPU utilization tracking is the gap between knowing a processor is busy and understanding why services are slowing down.
Many teams set up basic alert thresholds only to find themselves bombarded with notifications every time a routine cron job runs, while actual runaway threads quietly starve critical customer-facing processes of execution time. Alert fatigue quickly sets in, leading engineers to silence warnings and miss real degradations. Establishing effective cpu monitoring requires a deliberate approach that separates harmless resource spikes from true system bottlenecks, ensuring your infrastructure remains responsive without creating noise for your on-call team.
The central processing unit governs how fast your operating system and application services process requests. When a server runs out of compute capacity, latency increases across all dependent components, request queues back up, and downstream microservices begin timing out.
Proactive cpu monitoring helps infrastructure teams detect performance bottlenecks before they manifest as critical customer-facing incidents. It provides essential visibility into whether an application is constrained by compute resources or waiting on disk I/O, database queries, or external network connections.
Furthermore, analyzing CPU usage patterns over extended periods reveals whether your cloud instances or physical nodes are overprovisioned or underprovisioned. Right-sizing servers based on historical utilization data cuts infrastructure waste, prevents unexpected bill shocks across cloud providers, and ensures that capacity planning decisions are driven by concrete operational data rather than guesswork.
Building an actionable cpu monitoring workflow involves establishing reliable metric collection, clear evaluation windows, and structured alert channels. Follow this sequence to configure an effective setup:
Before defining alerts, understand the baseline workloads running on your servers. Differentiate between steady-state services, such as web servers and background workers, and batch processing tasks that naturally consume bursts of compute capacity during off-peak hours.
Install a monitoring agent or system plugin on each host. Ensure the collection tool captures user CPU time, system CPU time, I/O wait percentages, and idle time rather than relying solely on a single aggregated percentage.
Observe CPU usage trends over several business cycles—typically across peak daytime traffic, weekends, and scheduled maintenance windows. Knowing your normal operational baseline prevents premature alert tuning and unhelpful escalations.
Avoid setting alerts that trigger instantaneously when CPU crosses 85% or 90%. Instead, configure alerts to notify engineers only when utilization stays above your threshold for a sustained window, such as five or ten minutes.
Connect alerts to communication channels appropriate to the severity. Low-level sustained warnings can route to engineering triage dashboards, while critical saturations triggering high latency should alert on-call responders directly to investigate stuck processes.
Even experienced DevOps teams encounter common traps when configuring cpu monitoring. The most widespread issue is treating all CPU spikes as critical failures. Modern operating systems are designed to maximize processor capability during brief bursts; alerting on instantaneous peaks causes chronic alert fatigue.
Another frequent mistake is ignoring steal time and I/O wait metrics. In virtualized cloud environments, CPU steal indicates that the hypervisor is allocating compute cycles to other tenants on the same physical host. If you only track overall utilization percentage, you will overlook performance issues caused by noisy neighbors.
Finally, teams often fail to maintain coverage consistency. As environments scale, newly launched instances are frequently omitted from monitoring groups, creating unmonitored blind spots where runaway processes can exhaust capacity undetected until dependent services collapse.
BigBell provides unified infrastructure visibility that eliminates the complexity of piecing together fragmented metric dashboards. Rather than maintaining custom agent scripts for each environment, BigBell connects your servers across AWS, GCP, Azure, and on-premises hardware into a centralized operational view.
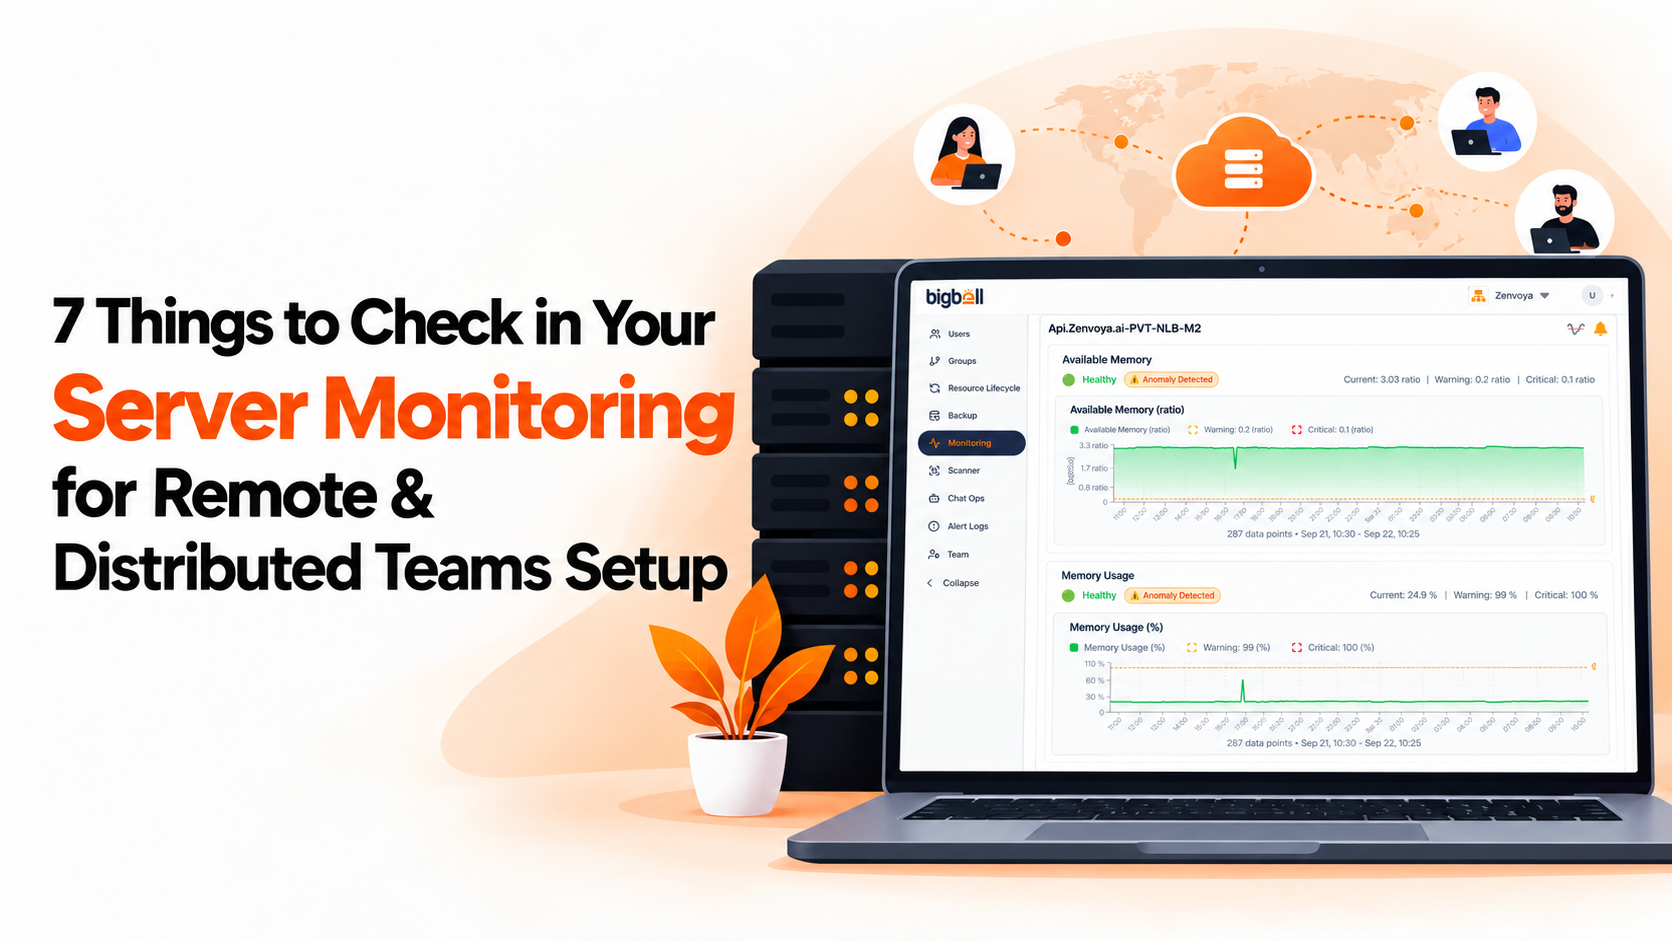
With BigBell, teams can inspect dedicated CPU monitoring graph data alongside disk and memory metrics for individual monitored hosts. The platform streamlines alert management by allowing teams to set precise metric thresholds and configure alert delay parameters to eliminate false-positive spikes.
BigBell also surfaces infrastructure blind spots by highlighting servers with missing alerts and categorizing overall health status so you immediately identify crashing or degrading nodes. This comprehensive oversight ensures your operations team maintains reliable capacity without having to build custom monitoring stacks from scratch.
Ready to simplify your infrastructure observability and eliminate blind spots? Book a demo today and explore our monitoring features to protect your workloads.
A healthy average range for general production workloads typically falls between 50% and 75% utilization. Operating consistently within this band ensures you have sufficient compute headroom to absorb unexpected traffic surges or background processing demands without experiencing service degradation. If baseline utilization regularly exceeds 80%, you should consider vertical scaling or optimizing resource-intensive application code.
CPU utilization measures the exact percentage of time the processor is actively executing instructions over a specific measurement interval. In contrast, CPU load average reflects the average number of processes that are either currently executing, waiting for CPU availability, or waiting for disk and network I/O. A server can exhibit low CPU percentage but high load average if processes are blocked on slow storage.
I/O wait represents the amount of time the CPU spends idling while waiting for outstanding disk read/write requests or network calls to complete. When diagnosing server responsiveness, a high I/O wait percentage indicates that the underlying bottleneck is disk performance or network bandwidth rather than inadequate processing power.
To reduce unnecessary noise in your cpu monitoring pipeline, always introduce duration criteria to your alert definitions. Instead of firing an alert immediately upon reaching 90% CPU, configure the rule to trigger only if the condition persists for 5 to 10 consecutive minutes. This allows routine operations like package updates, backups, and short compilation jobs to run without paging engineers.
Yes. When an application experiences a severe memory leak, the operating system may exhaust RAM and begin aggressive memory paging to swap storage. This causes system CPU and I/O wait metrics to spike dramatically as the kernel struggles to manage memory pages. Similarly, infinite loops or unhandled exceptions in background threads maintain continuous 100% utilization on individual CPU cores, which is readily visible on historical time-series graphs.